Fundamentals · Published July 16, 2026

How to Read a Company's Financials in 60 Seconds

By Slowio

Annual reports run to hundreds of pages, and most of the numbers that matter are scattered across three statements and twenty fiscal years. Reading them front-to-back is neither realistic nor necessary: the first pass of company analysis only has to answer whether the business is worth a second look.

That first pass can be systematic. Condense valuation, balance-sheet health and efficiency into a handful of scores, then scan the long history of revenues, margins, cash flows and debt for the shape of the business. Below, the method applied to a real company — Ferrari — exactly as it appears on Slowio’s analysis page.

Charts and figures are computed from Slowio’s data snapshot as of 2026-07-16 and are refreshed when the article is next updated.
Feature spotlight · Company analysis

The 60-second company check

1Search a company — by name or ticker, across the thousands of companies Slowio follows.
2Read its four scores — price, balance sheet, profitability and an overall blend, each 0–100.
3Scroll up to 40+ years of financial statements, charted.

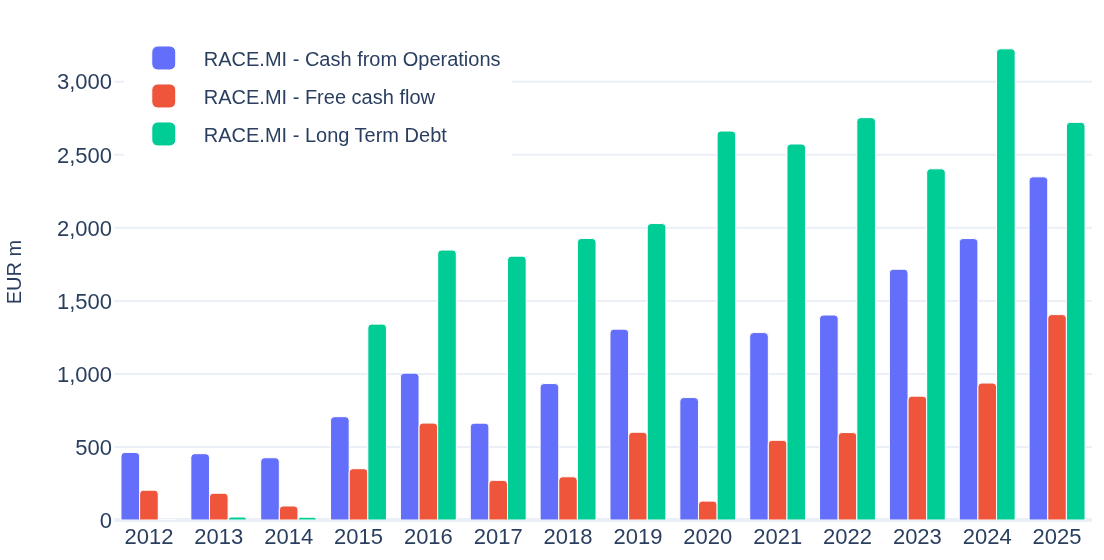
Step 3 in practice — 14 fiscal years of Ferrari NV, two of the charts from the analysis page:
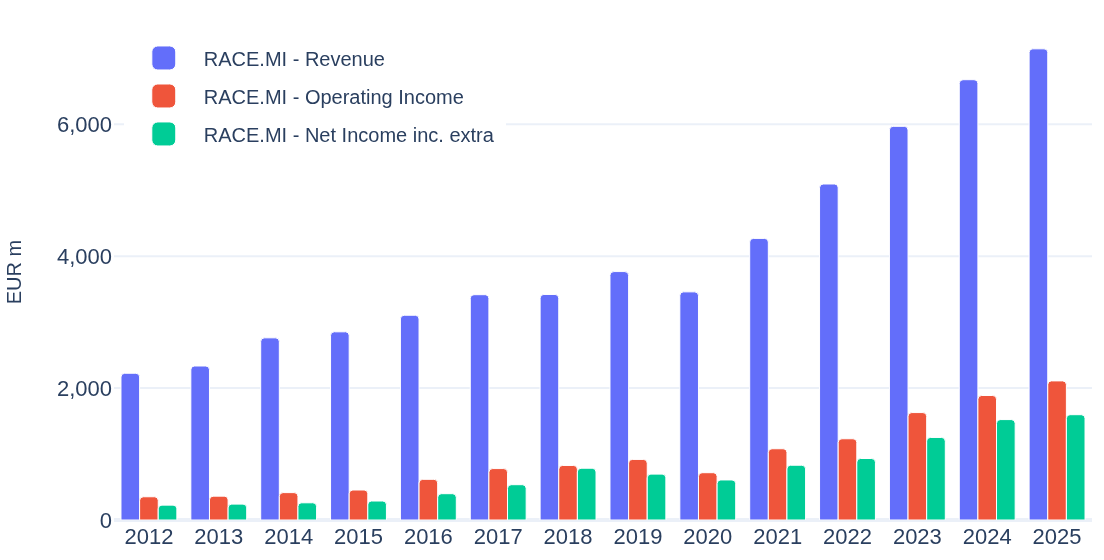
Bar chart: Ferrari NV revenue, operating income and net income by fiscal year, 2012-2025
Ferrari NV — revenue, operating income and net income by fiscal year (EUR m), as charted on the analysis page.
Bar chart: Ferrari NV cash from operations, free cash flow and long-term debt by fiscal year, 2012-2025
Ferrari NV — cash from operations, free cash flow and long-term debt by fiscal year (EUR m): cash generation versus long-term debt.

And steps 1–2: the same page distills those statements into four scores and the key ratios. Ferrari NV right now:

RACE.MI · Ferrari NV
Consumer Cyclical · Auto Manufacturers · Italy
50
Global
17
Value
79
Health
88
Efficiency

Each score condenses dozens of ratios into a 0–100 reading: how the price compares with earnings and book value (Value), how solid the balance sheet is (Health), and how much profit the business squeezes from its assets (Efficiency). Under the scores sit the ratios themselves:

48.2
P/E avg
19.7
Price / Book
27.3%
Oper. margin avg
40.8%
ROE avg
+15.8%
EPS 5y CAGR
0.6%
Dividend yield avg

And one step further — the Correlations tab puts Ferrari NV next to the four big asset classes: US equities (SPY.US), long-term Treasuries (TLT.US), inflation-linked Treasuries (TIP.US) and gold (GLD.US). Over 180-day returns since 2016, the tightest link is RACE.MI–GLD.US at -0.31; against inflation-linked Treasuries it drops to +0.06.
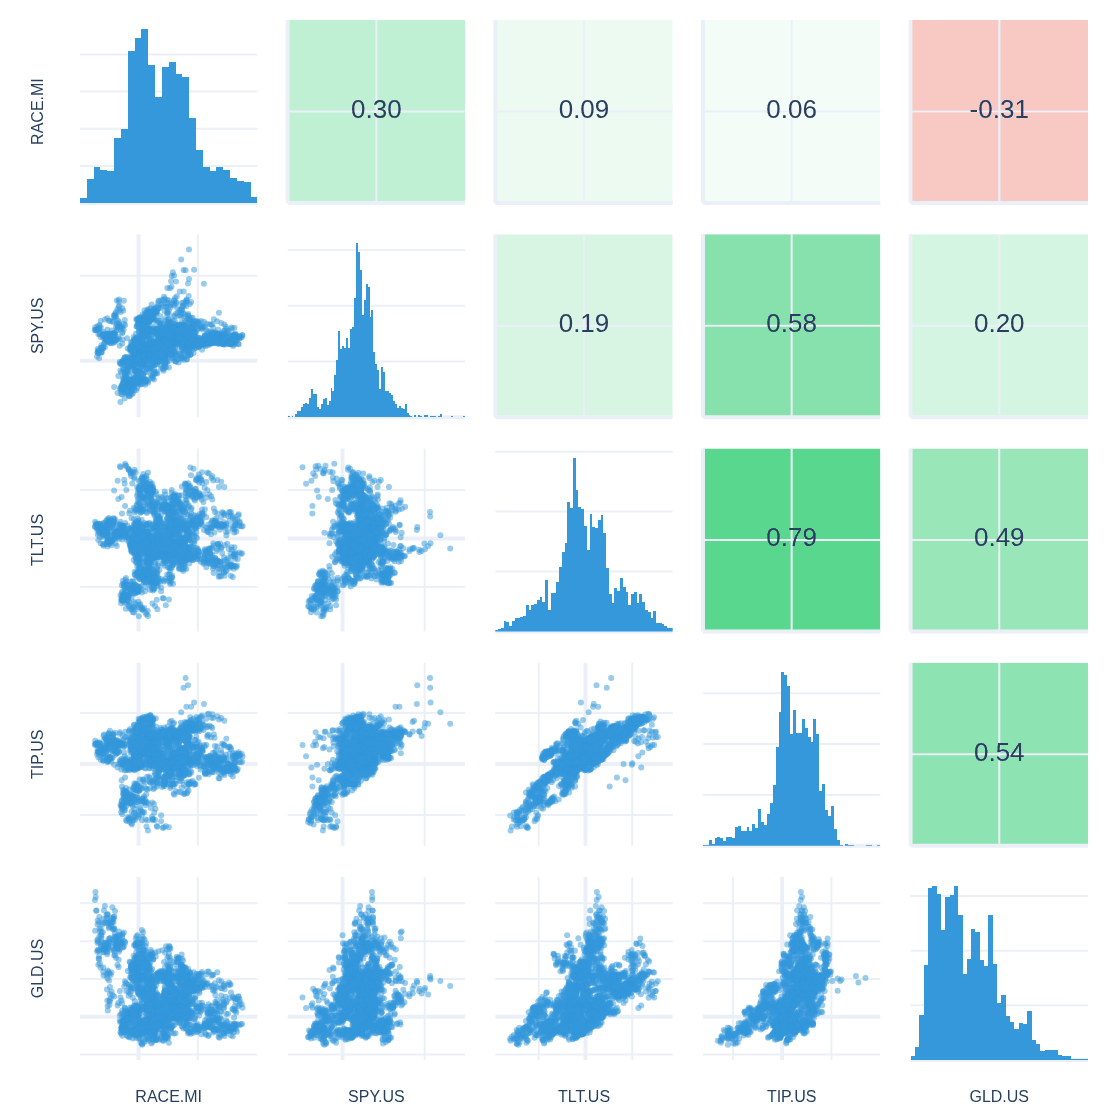
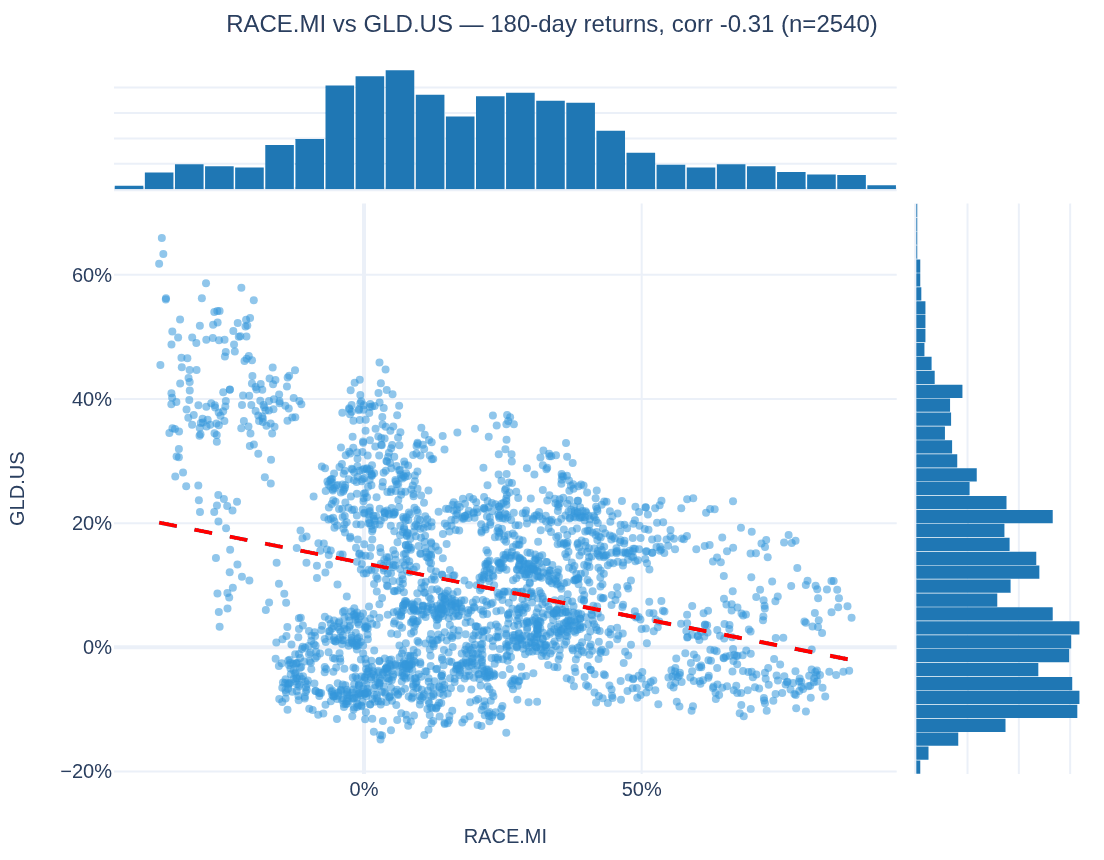
Chart matrix: pairwise 180-day return scatters, histograms and correlation values for RACE.MI, SPY, TLT, TIP and GLD
Every pair — scatter below the diagonal, return histograms on it, correlation above: 2,540 overlapping 180-day observations, 2016–2026, each series in its listing currency.
Scatter chart with marginal histograms: RACE.MI versus GLD.US 180-day returns with regression line
The tightest pair up close — RACE.MI versus GLD.US — with the return distributions on the margins; the dashed line is the fitted trend.

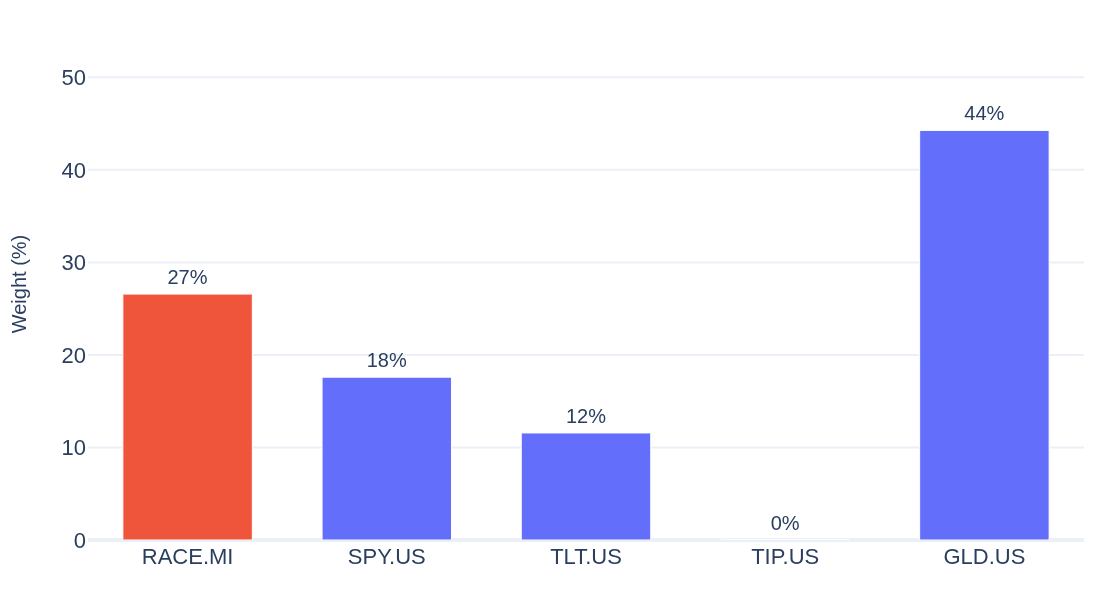
What weight does Ferrari NV get in that mix? The Rebalance & Opt. tab’s Max Diversification objective — the weights that damp how much the five move together — answers with numbers: the optimizer gives RACE.MI a 27% seat, and the mix’s diversification ratio improves to 1.74 from 1.39 for the best four-ETF mix.
Bar chart: Max Diversification weights for RACE.MI and the four asset-class ETFs
The maximum-diversification mix, computed by the app’s optimizer on the same 180-day returns (diversification ratio: how much less the whole moves than its parts — higher is more diversified). A hypothetical, educational exercise — not an allocation recommendation.
Open the full analysis →

Slowio is an educational research tool, not financial advice. Figures are computed from Slowio’s data snapshot at build time and may not reflect the latest market data — nothing in this email is a recommendation to buy or sell any security. Do your own research.

Create a free Slowio account →

Run the same analysis on any of the 9,000+ companies Slowio follows — free, no card required.