
Compounding is the one piece of financial arithmetic everyone has heard of and almost everyone underestimates — because its growth is invisible early and overwhelming late, and intuition extrapolates the early part. The honest way to build intuition is to compute it: the same contributions, twenty-five years, three hypothetical growth rates, drawn as curves.
Two details in those curves do most of the teaching: the breakeven year, where accumulated growth overtakes total contributions — and the cost of delay, visible when the same inputs simply start later. Both are below, as an educational exercise with every assumption stated.
The arithmetic of compounding, interactive
Compounding is pure arithmetic — but arithmetic over 25 years is hard to picture. The calculator on Slowio draws it: set a starting amount, a periodic contribution and a hypothetical annual growth rate, and the curve appears year by year. One worked illustration — $10,000 to start, $500 added monthly, 25 years, at three hypothetical rates:
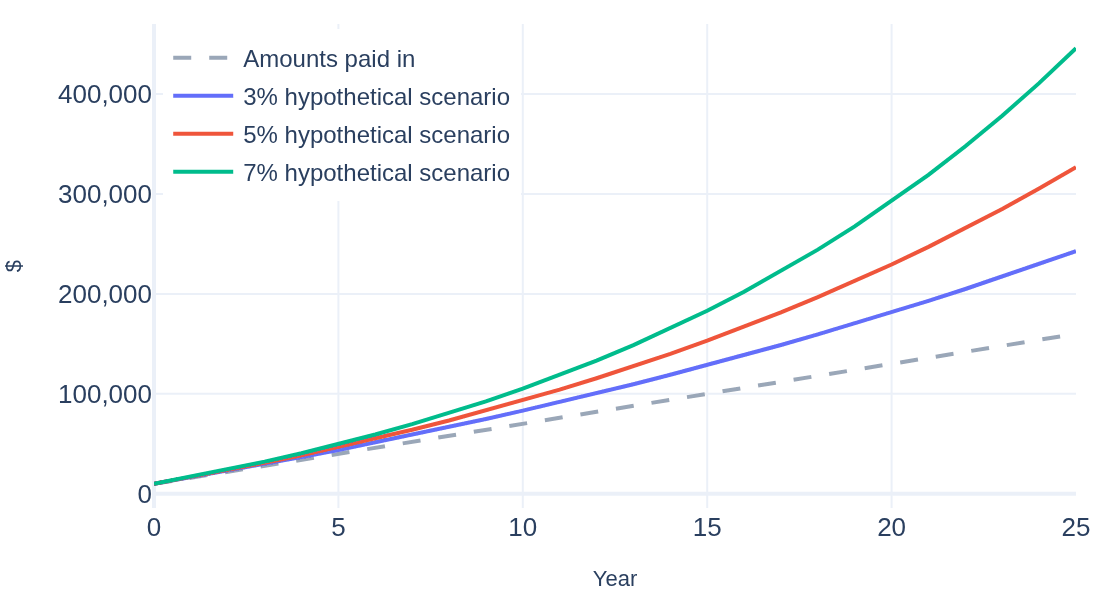
The amounts paid in are the same $160,000 in every curve ($10,000 to start plus 300 monthly contributions of $500) — the whole gap between the lines is compounding at work. In the 7% scenario the end value reaches $445,795, +$285,795 above the amounts paid in (179%); at 3% the same payments end at $242,685. The calculator’s breakeven view adds a detail that is easy to miss: in the 7% scenario it takes until year 18 before cumulative compound growth exceeds everything paid in — the curve is flat for a long time before it is steep.
Reproduce it in the calculator’s Growth tab: Starting Amount $10,000 · Regular Contribution $500, Contribution Frequency Monthly · Time Horizon 25 years · Annual Fee (TER) 0% · Transaction Cost $0 · Expected Annual Yield 3, 5 or 7 (the hypothetical rate) · inflation-adjusted display off.
Same inputs, later start
A second reading from the same tab. Keep every input identical — $500 monthly at the 7% hypothetical rate — and only shorten the Time Horizon to 20 or 15 years: arithmetically, that is what starting 5 or 10 years later does to a plan that ends on the same date.
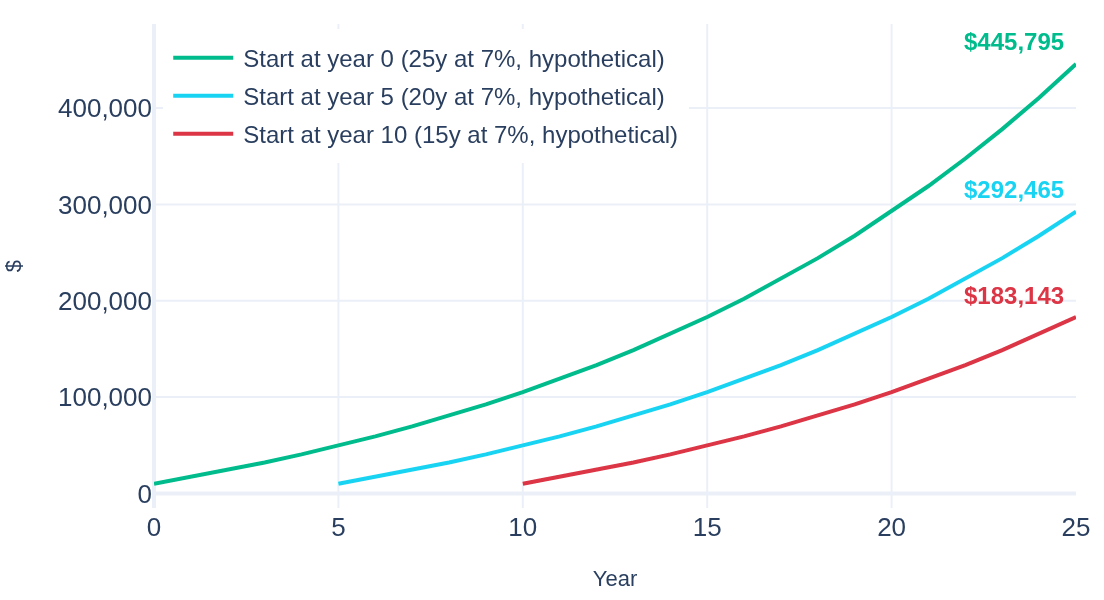
Starting 10 years later removes $60,000 of contributions from the plan, but $262,652 from the end value — roughly 4× the contributions it skips. The early years look flat on the chart, yet they are the ones that compound for longest — the same detail the breakeven reading above points at.
The same page carries seven more tabs on the same engine — a goal planner (solve for the contribution or the rate a target implies), Monte Carlo simulations, withdrawal planners, Kelly allocation and a bond yield-to-maturity calculator — and a separate DCF calculator, a step-by-step discounted-cash-flow page.