
Discounted cash flow is the valuation method everything else abbreviates. The idea fits in one sentence — a business is worth the cash it will generate, discounted back to today — but the mechanics live in the details: how far to project, what discount rate to apply, and how to value everything beyond the projection window.
Those mechanics are best learned by working one example end to end. Below, a complete DCF walkthrough on stated inputs: projected free cash flows, present values bar by bar, and the terminal value via the Gordon Growth formula — an educational exercise, with every number visible.
What future cash flows are worth today
A discounted-cash-flow valuation rests on one idea: an amount received years from now is worth less than the same amount today. The DCF walkthrough page on Slowio makes the method visible — set a starting free cash flow, drag a growth path over 10 years, choose a discount rate and a terminal-value method, and the whole valuation recomputes live. Here is its opening example, a hypothetical company with USD 1,000,000 of free cash flow:
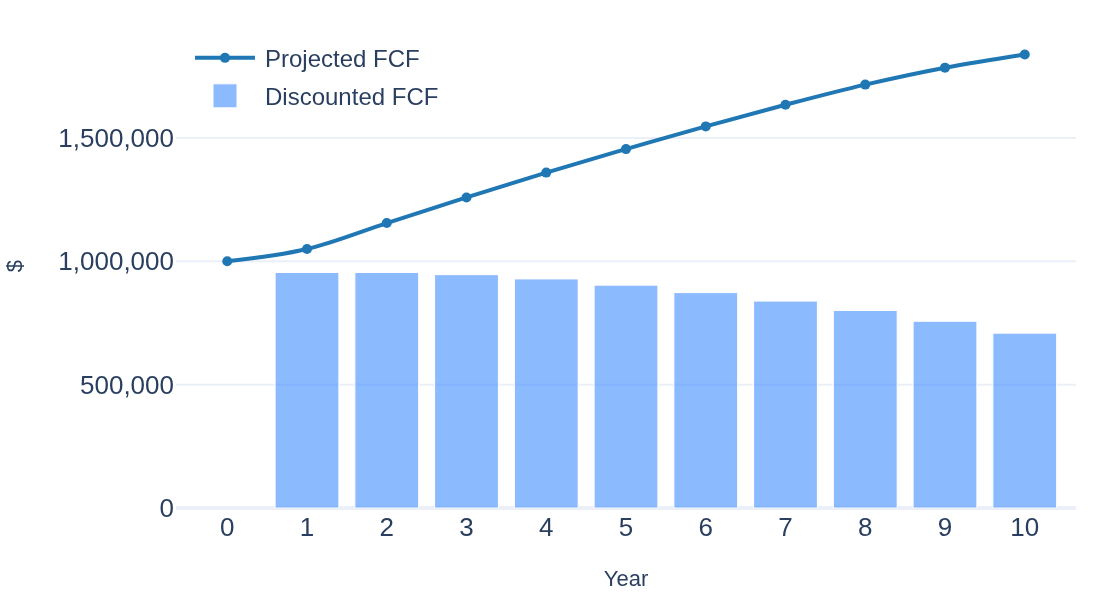
Step by step: the 10 projected cash flows, each discounted back at 10%, add up to USD 8.7M. Everything after year 10 is folded into a terminal value — the Gordon Growth method treats the final USD 1.8M cash flow as growing at 2.5% forever, worth USD 25.1M in year-10 money and USD 9.7M today. Together: USD 18.4M, or USD 18.35 per share across 1,000,000 shares.
Two readings worth pausing on. First, 53% of the value sits in the terminal assumption — which is why the page lets the method be swapped (exit multiple, no-growth perpetuity, H-model, convergence) and shows a sensitivity table. Second, the discount rate dominates everything: the same cash flows are worth USD 25.42 per share at 8% and USD 14.28 at 12% — a 1.8× spread from moving the rate two points either way. A DCF is arithmetic on assumptions; the page’s purpose is to show how, not to value any actual company.
Reproduce it on the page (these are its own starting values — it loads showing exactly this valuation). Parameters & Method: Last Year FCF (USD) 1,000,000 · Discount Rate (%) 10 · Outstanding Shares 1,000,000 · Terminal Growth Rate (%) 2.5 · Terminal Value Method Gordon Growth Model (Default). Projection Settings (the growth path): Year 2 → 10% · Year 5 → 7% · Year 8 → 5% · Year 10 → 3% — the page interpolates the years in between linearly.