
Two companies in the same business can be genuinely hard to rank: different reporting currencies, different fiscal calendars, different disclosure styles. Most side-by-side comparisons quietly fall apart because the numbers being compared were not computed the same way.
The fix is mechanical rather than clever: put both companies on one yardstick — identical score definitions, identical ratio formulas, identical fiscal-year alignment — and let the differences that remain be real ones. Below, the method applied to Adyen and PayPal, two payment companies with very different profiles.
Two companies, same yardstick
Reading two annual reports side by side takes an afternoon. The Comparisons page computes the same four scores and the same ratios, the same way, for every company Slowio follows — so a Dutch payments platform and a US one line up on a single yardstick. Adyen NV next to PayPal Holdings Inc, from the latest fiscal year on file:
Any ratio can be charted for both companies at once. Return on equity, for instance — the same profitability yardstick regardless of reporting currency:
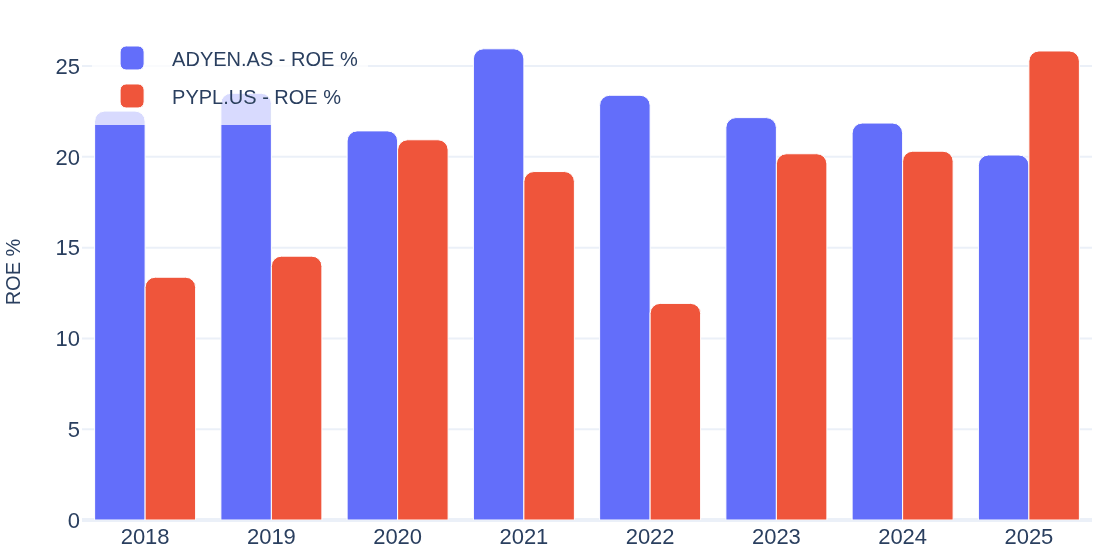
The numbers tell a price-versus-growth story: both businesses earn a comparable return on equity (22.2% vs 20.4%, 5-year basis), but Adyen NV grew earnings per share +31% a year over five years against +9% for PayPal Holdings Inc — and the market prices that difference at 41.0× versus 15.3× average earnings. Whether either price is justified is exactly the kind of question the page is built to frame.
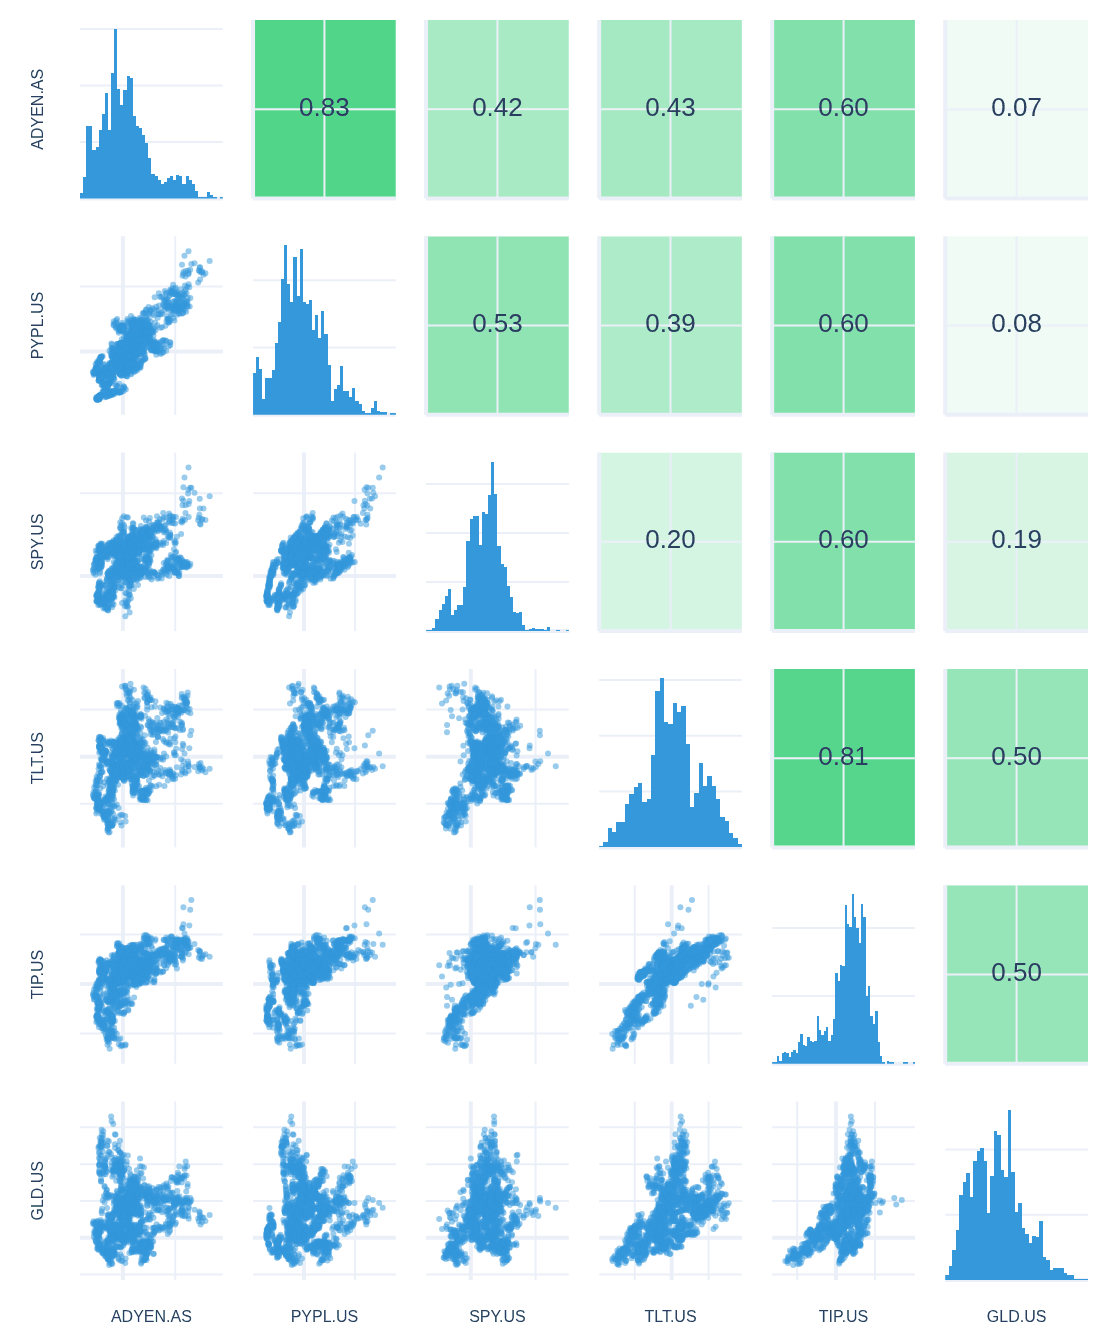
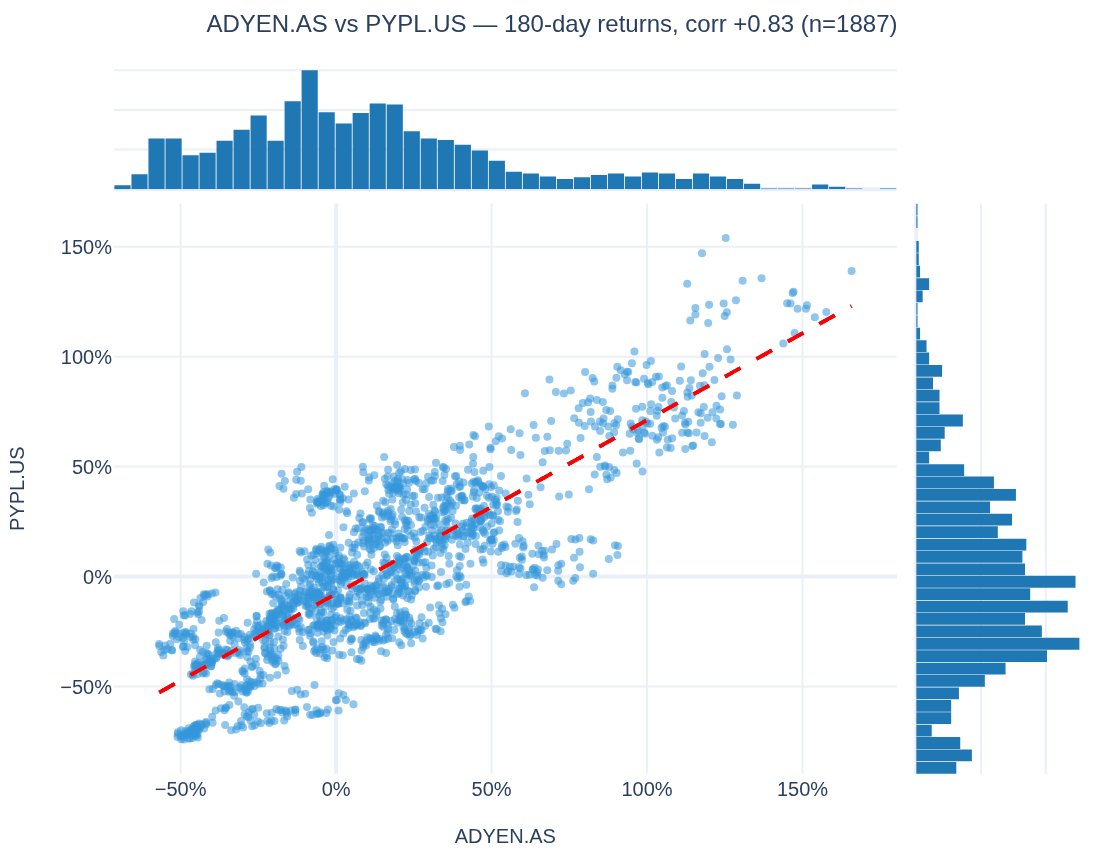
The same yardstick extends to how the two move: over 180-day returns since 2019, Adyen NV and PayPal Holdings Inc correlate at +0.83 — and the Correlations tab puts both next to the four big asset classes (US equities, long-term and inflation-linked Treasuries, gold):
The link opens the Comparisons page with ADYEN.AS and PYPL.US preselected — any other company can be added from the dropdown.