Every valuation ratio needs a reference point. A price-to-earnings of 18 sits above the typical automaker’s multiple, in line with a typical software company’s and below a typical luxury house’s — the same number, three different readings. Without the sector context, a ratio is just a number floating in space.
The context can be computed: weighted medians of every ratio, per sector and per industry, across thousands of companies and five fiscal years. Below, what that looks like for Ferrari — a carmaker priced like neither a carmaker nor quite a luxury house — and why the gap itself is the analysis.
A company against its peers
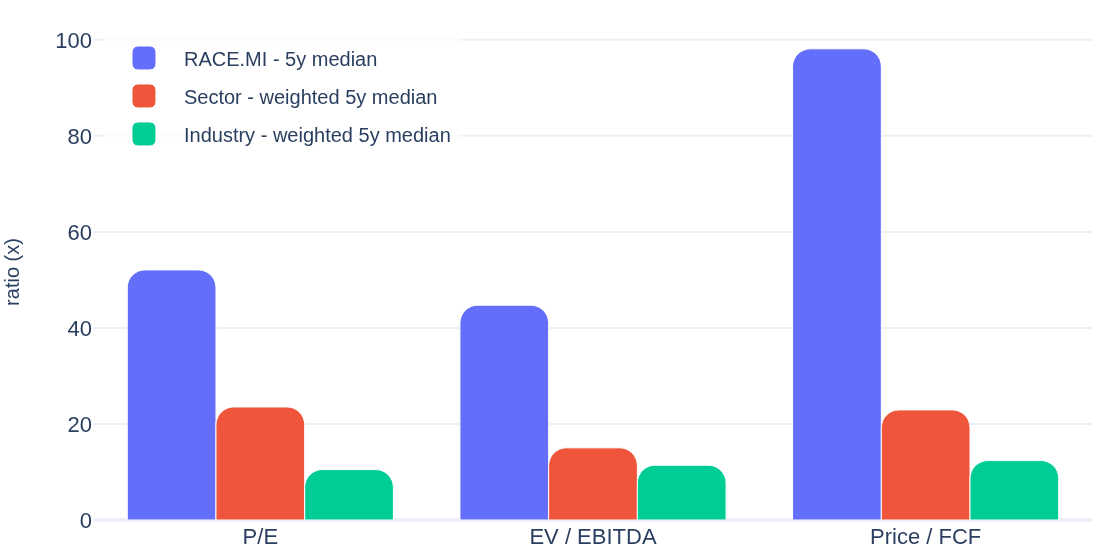
A P/E of 52 means little on its own — high for a typical bank, ordinary for a software house. On every analysis page, Slowio puts the company’s ratios next to the market-cap-weighted medians of its sector and its industry, computed across all companies in each group. Here is Ferrari NV against Consumer Cyclical (1,149 companies) and Auto Manufacturers (70 companies):
RACE.MI · Ferrari NV
Consumer Cyclical · Auto Manufacturers · Italy
| 5y median | RACE.MI | Sector | Industry |
|---|---|---|---|
| P/E | 52.1 | 23.5 | 10.5 |
| EV / EBITDA | 44.7 | 15.0 | 11.4 |
| Price / FCF | 98.1 | 22.9 | 12.4 |
| Dividend / EPS % | 26.5% | 16.3% | 0.0% |
| Dividend yield % | 0.5% | 0.7% | 0.1% |
A weighted median of 0.0% is a real reading: more than half of that group’s market value pays no dividend.
Across the valuation multiples the pattern is consistent: Ferrari NV trades at 52.1× 5-year-average earnings, roughly 2.2× its sector median (23.5) and 5.0× its industry median (10.5) — the market prices it as a luxury house rather than a carmaker. Whether the premium is deserved is the research question; the analysis page shows these medians in the ratio tooltips and can overlay them on every chart.
The multiples say luxury house — and whether the shares also move like one is a separate, checkable question. The Correlations tab puts Ferrari NV next to two fellow carmakers (BMW, Volkswagen) and two luxury houses (LVMH, Hermès), all EUR-listed, over 180-day returns:
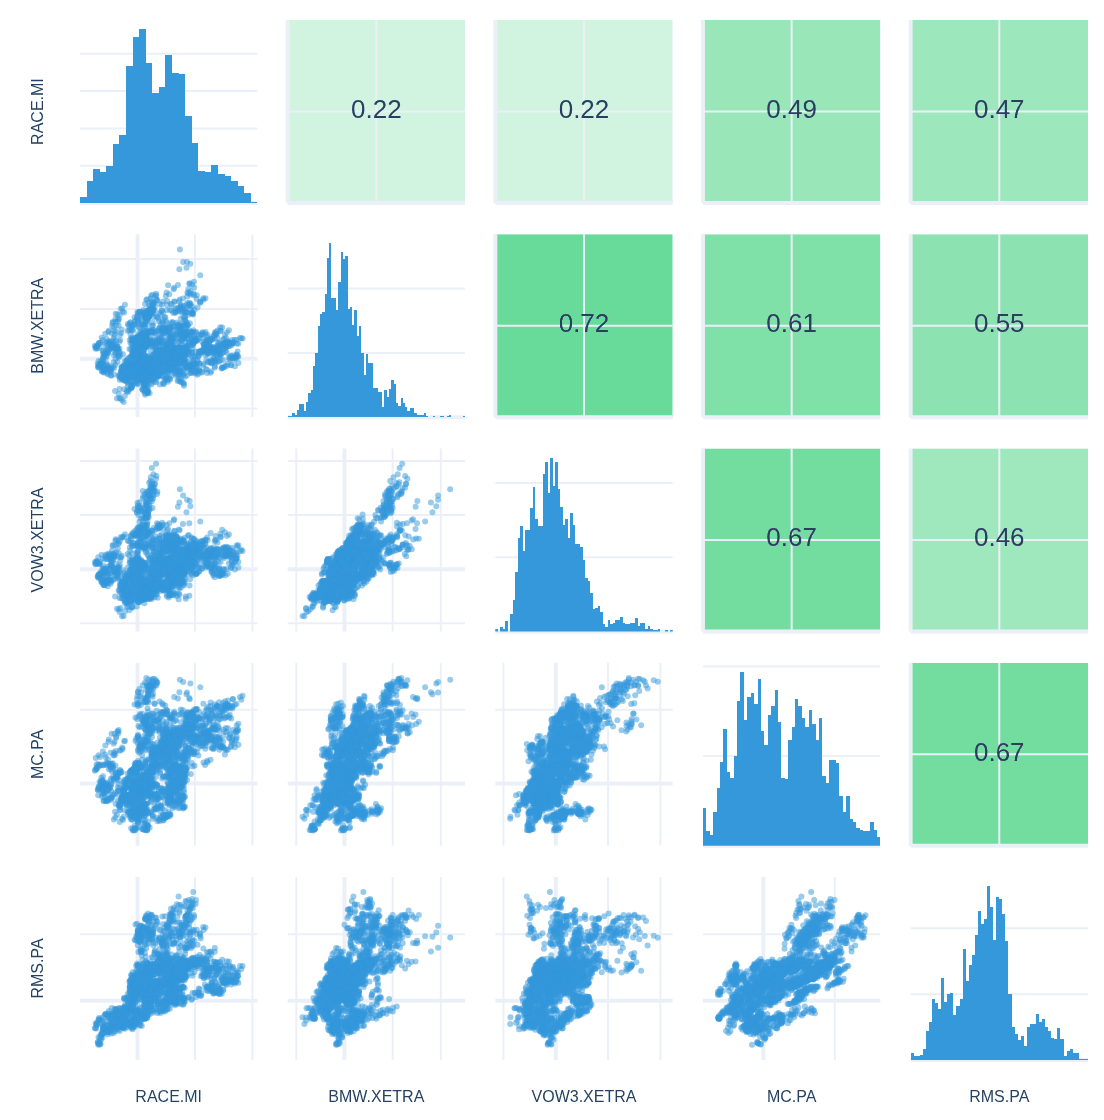
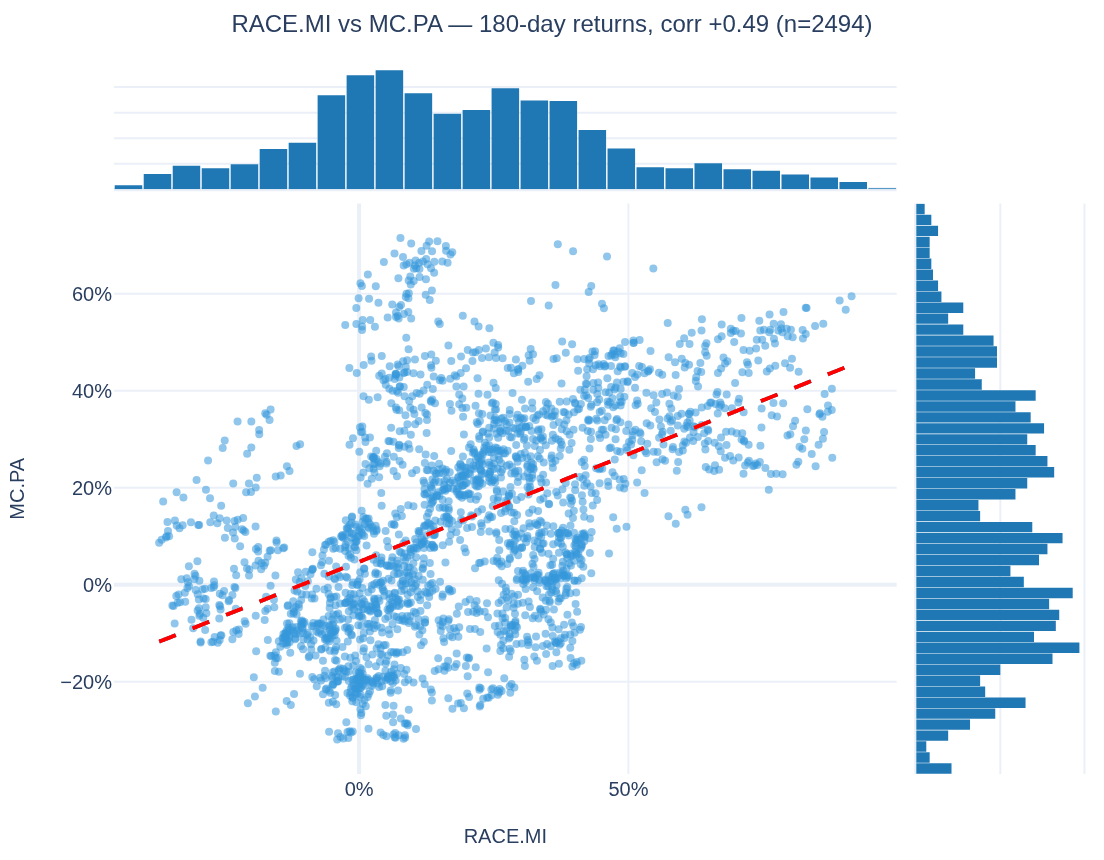
Across the matrix, RACE.MI averages +0.48 correlation with the luxury pair and +0.22 with the carmakers — on this window the tape agrees with the price tag: RACE.MI moves with the luxury houses, not the carmakers. BMW and Volkswagen meanwhile track each other at +0.72 — a carmakers’ pack RACE.MI doesn’t run with. The tightest single pairing up close: