
Fund fees are quoted in numbers small enough to ignore — 0.07%, 0.32% — and that framing is exactly why they are ignored. A fee is charged on the whole balance every year forever, which means it compounds with the same arithmetic that grows the balance itself. Over thirty years, a fraction of a percent is not a rounding error.
The cleanest way to see it is two ETFs tracking nearly the same world index at very different expense ratios. Below, the comparison drawn out: same exposure, several times the yearly cost, and the widening gap when the fee drag is extended over a long horizon.
Two world ETFs, 5.3× the yearly cost
Both of these funds hold the whole world in one ETF — developed and emerging markets, thousands of companies, the same category (Equity: Global). The ETF-Compare page puts them side by side:
The same page scores each fund as a product — what it costs, how established it is, how spread out its holdings are. The largest score gap between the two is Cost: 55 points.
Slowio ETF scores · 0 to 100
| |||||||||||||||||||||||||||||||
Each score measures the fund as a product against a reference value set for its family of funds: meeting the reference gives 75, and no fund reaches 100. They describe the fund as it is today — not what it will return. Compare any two funds →
Compounded, that sentence becomes dollars. On the Cost tab’s own formula — the fee eating at a static $10,000, no market return assumed — 0.32% a year adds up to $915 of cumulative cost over 30 years, against $178 at 0.06% — a $737 gap on the same exposure.
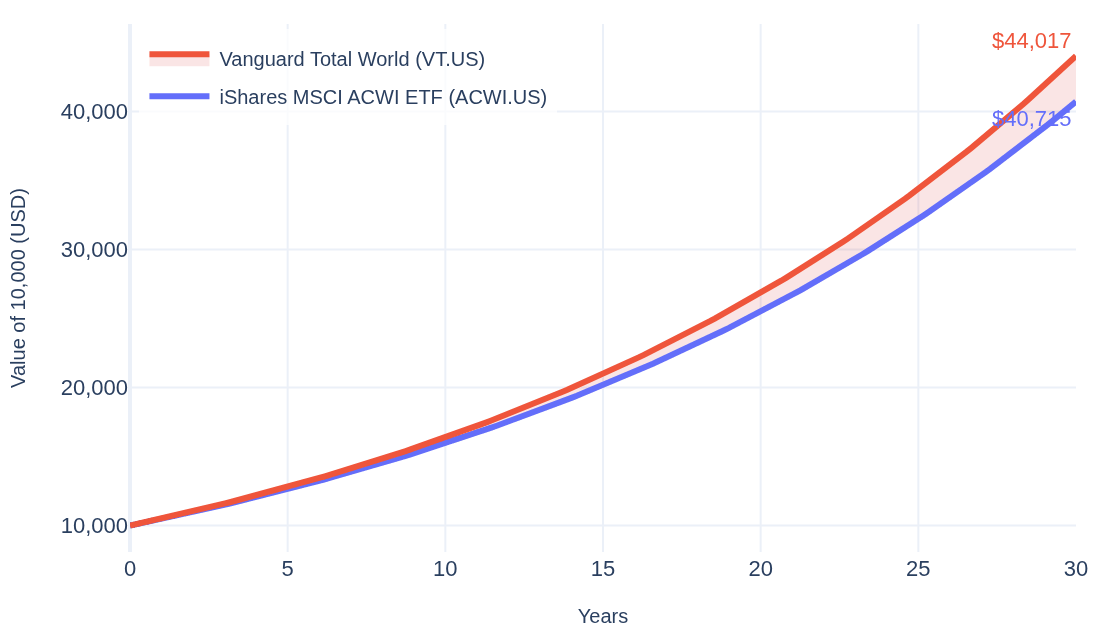
Growth raises the stakes. Let the same $10,000 compound at a flat, hypothetical 5% a year — identical for both funds, so the only difference is each fund’s fee — and after 30 years the position ends at $44,017 in the lower-fee fund versus $40,715 in the higher-fee one. The same 0.26-point fee difference now costs $3,303 — 4.5× the no-growth gap, because the fee also eats the growth it would have compounded. Put differently: the higher fee consumes 9.2% of the 30-year outcome, the lower one 1.8%:
The same page works for any two or three ETFs Slowio follows — the scores, TER, size, returns and volatility in one table.