
An ETF’s name is marketing; its holdings are the product. Two funds with near-identical names can differ completely in sector tilt, country exposure and concentration — and the difference only shows up when the composition is laid out: which sectors, which countries, which ten companies actually dominate the basket.
Below, a full x-ray of one of Europe’s most widely held funds — the iShares Core MSCI World ETF — from sector donut to holdings flow, plus a “fee twin”: a fund with nearly the same exposure at a very different yearly cost.
X-ray any ETF before choosing it
Two ETFs with near-identical names can hold very different things. The ETF page on Slowio opens one up before it is chosen: what it actually holds, how it spreads across sectors and regions, what it costs each year. Here is that x-ray for one of the largest world ETFs Slowio follows:
SWDA.MI · iShares Core MSCI World UCITS ETF USD
Equity: Global · domiciled in Ireland · EUR listing
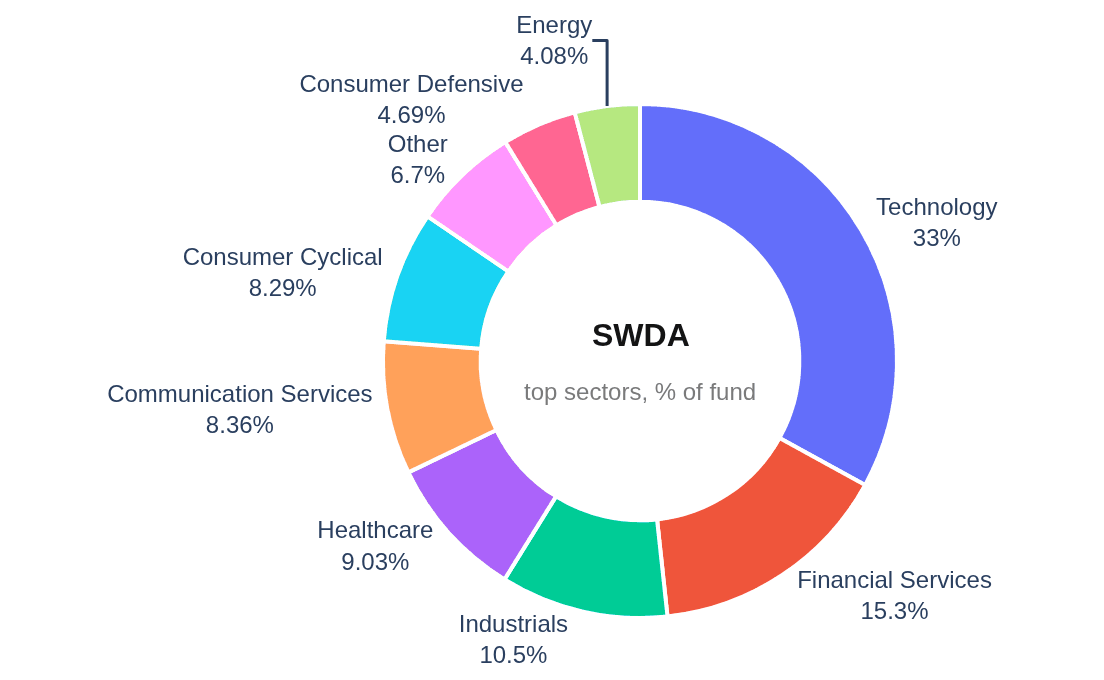
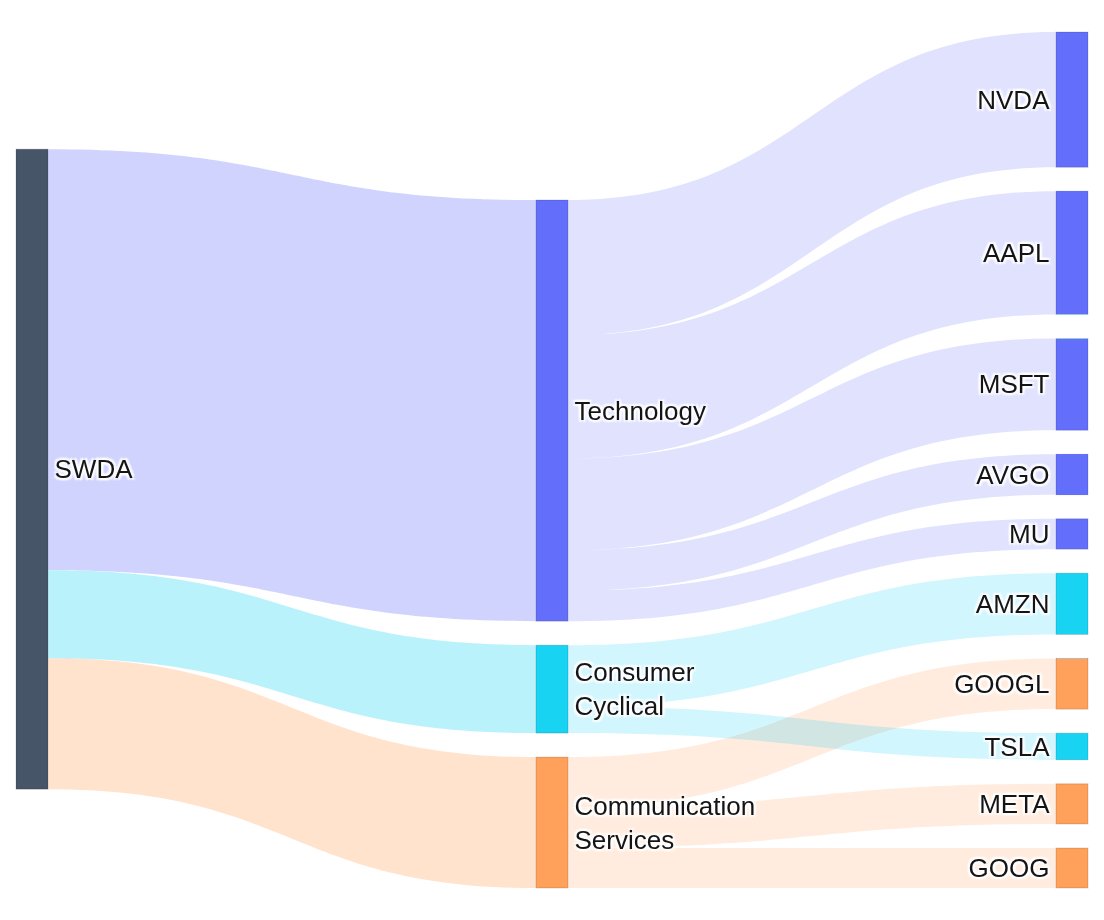
Behind the charts, the page condenses the fund facts that take longest to dig out of a factsheet:
One number in that band deserves a second look: the fee. SPDR® MSCI World UCITS ETF (SWRD.LSE) tracks the same index (it is in both names), 74% North America to 75% — yet its yearly cost is 0.12% to 0.20%: the larger fund charges 1.7× as much for near-identical exposure. The Score tab of the ETF page puts that in one picture — the largest score gap is Cost, 19 points:
Slowio ETF scores · 0 to 100
| |||||||||||||||||||||||||||||||
Each score measures the fund as a product against a reference value set for its family of funds: meeting the reference gives 75, and no fund reaches 100. They describe the fund as it is today — not what it will return. See the Score tab →
The same page adds performance and risk tabs, cost analysis, and a “find similar ETFs” search — one URL per fund, for any ETF Slowio follows.