
Slowio maintains a standing quantitative model of US inflation and its implications for the risk-free rate and equity valuation, refreshed with sourced data roughly monthly. Each refresh, this digest records what moved since the prior run; the full report — force ledger, scenarios and sources — lives on the permanent Macro Outlook page. Analytical framework output — educational tool only, not financial advice.
This issue: the July 2026 refresh, covering what moved since the prior model run.
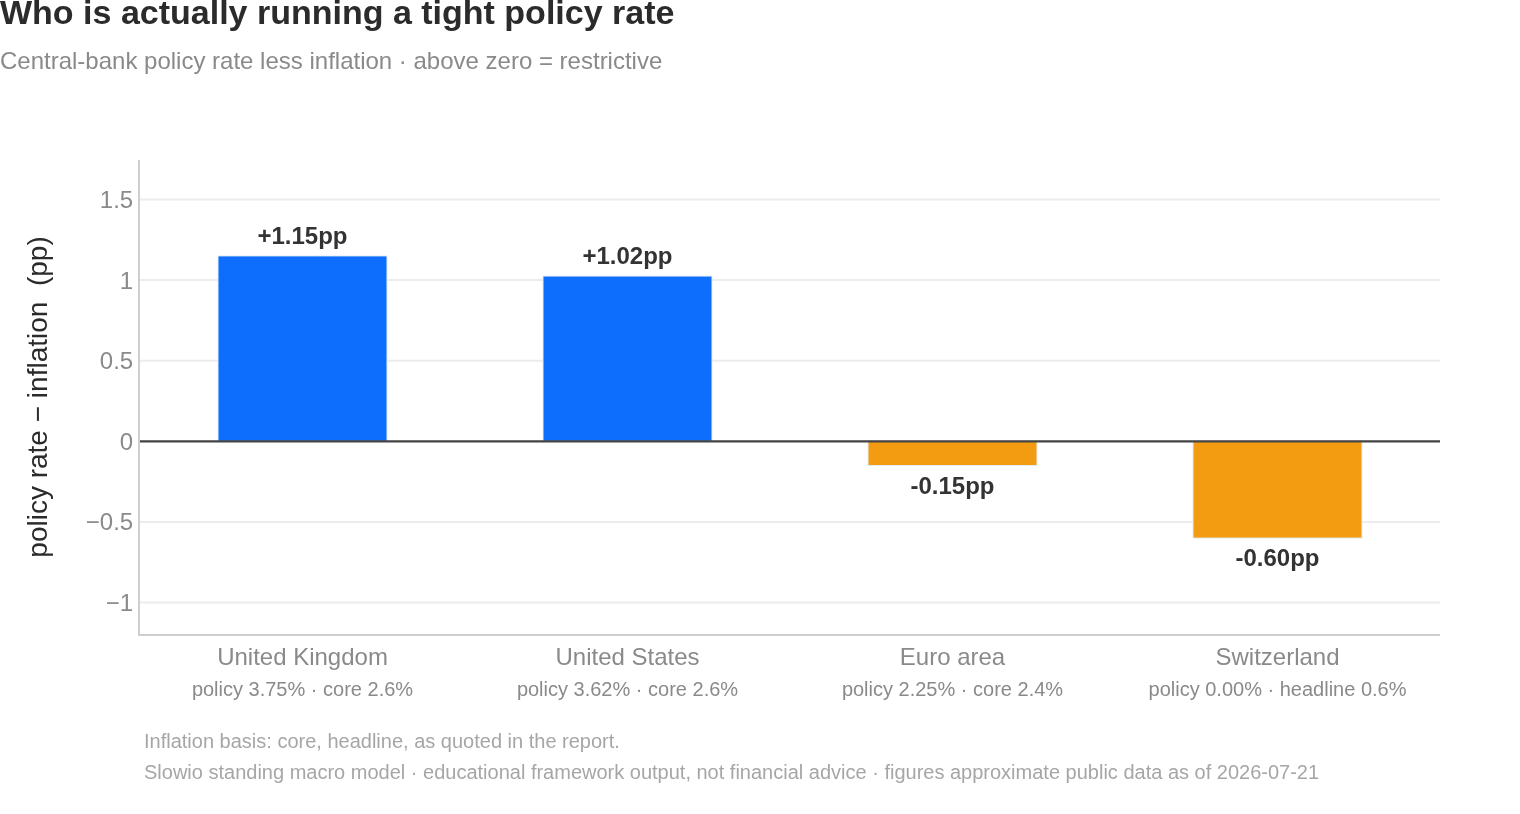
No new US inflation print. June CPI (headline 3.5% YoY / −0.4% MoM, core 2.6% YoY / flat MoM) was already in the prior run's context — it published the morning of 07-14. The CPI fell a seasonally adjusted 0.4% for the month, bringing the annual inflation rate down to 3.5%; core inflation was flat on the month, putting the 12-month rate at 2.6%. The next CPI (July data) lands 2026-08-12; the next PCE (June) is due late July. Core PCE (May) 3.4% YoY is carried forward — FLAGGED STALE. The core PCE price index climbed 3.4% year-over-year in May, the highest level since October 2023 and a pickup from April's 3.3%.
The real move since 07-14 is price action, not data:
- Equities down. S&P 500 fell from ~7,575 to ~7,443 as an AI/semiconductor rotation and renewed Middle-East risk weighed. The S&P 500 fell 0.19% to close at 7,443.28.
- 10Y up. From 4.55% to ~4.57–4.60%. The yield on US 10-Year Note Bond Yield rose to 4.60% on July 20, 2026. Post-CPI it briefly eased toward 4.52%. The US 10-year Treasury yield has eased to about 4.52% after cooler price data. 2Y ~4.19%.
- Oil up. WTI ~$82 (from ~$80); the Iran ceasefire collapsed. Vessel traffic through the Strait of Hormuz declined sharply following Iranian attacks on ships over the weekend, and crude rose to a five-week high of around $83 per barrel.
- Fed pricing. July-29 hold ~87%. According to the CME FedWatch Tool as of 20 Jul 2026, there is an 86.7% probability the Fed will maintain interest rates in the upcoming meeting. Sept hike odds firmed to ~53–63%. Markets are now pricing in around a 53% chance of a Fed rate hike in September, up from 47% a day earlier.
- AI capex intact. No cuts/writedowns; 2026 hyperscaler capex still ~$725B. Google, Amazon, Microsoft, and Meta collectively plan to allocate $725 billion to capital expenditures in 2026 — up 77% — with Amazon at $200B, Alphabet $175–185B, Meta $115–135B, and Microsoft toward $190B. Big-Tech earnings (Alphabet Wed) are the near-term catalyst.
Ledger changes:
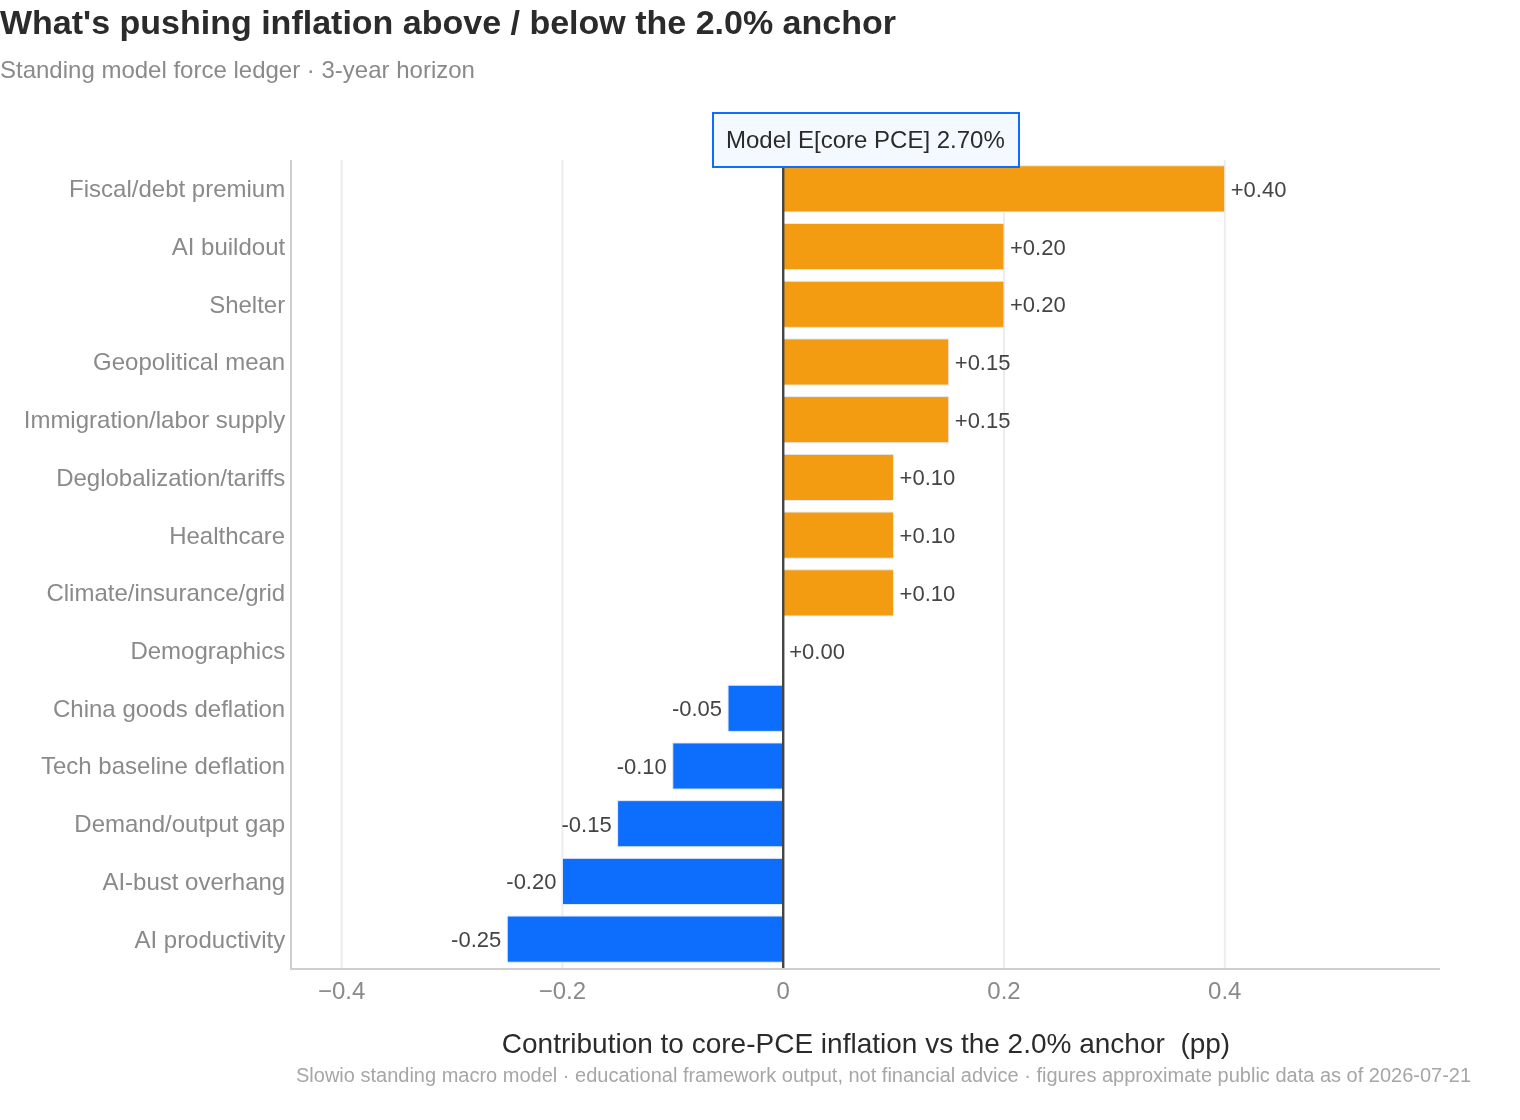
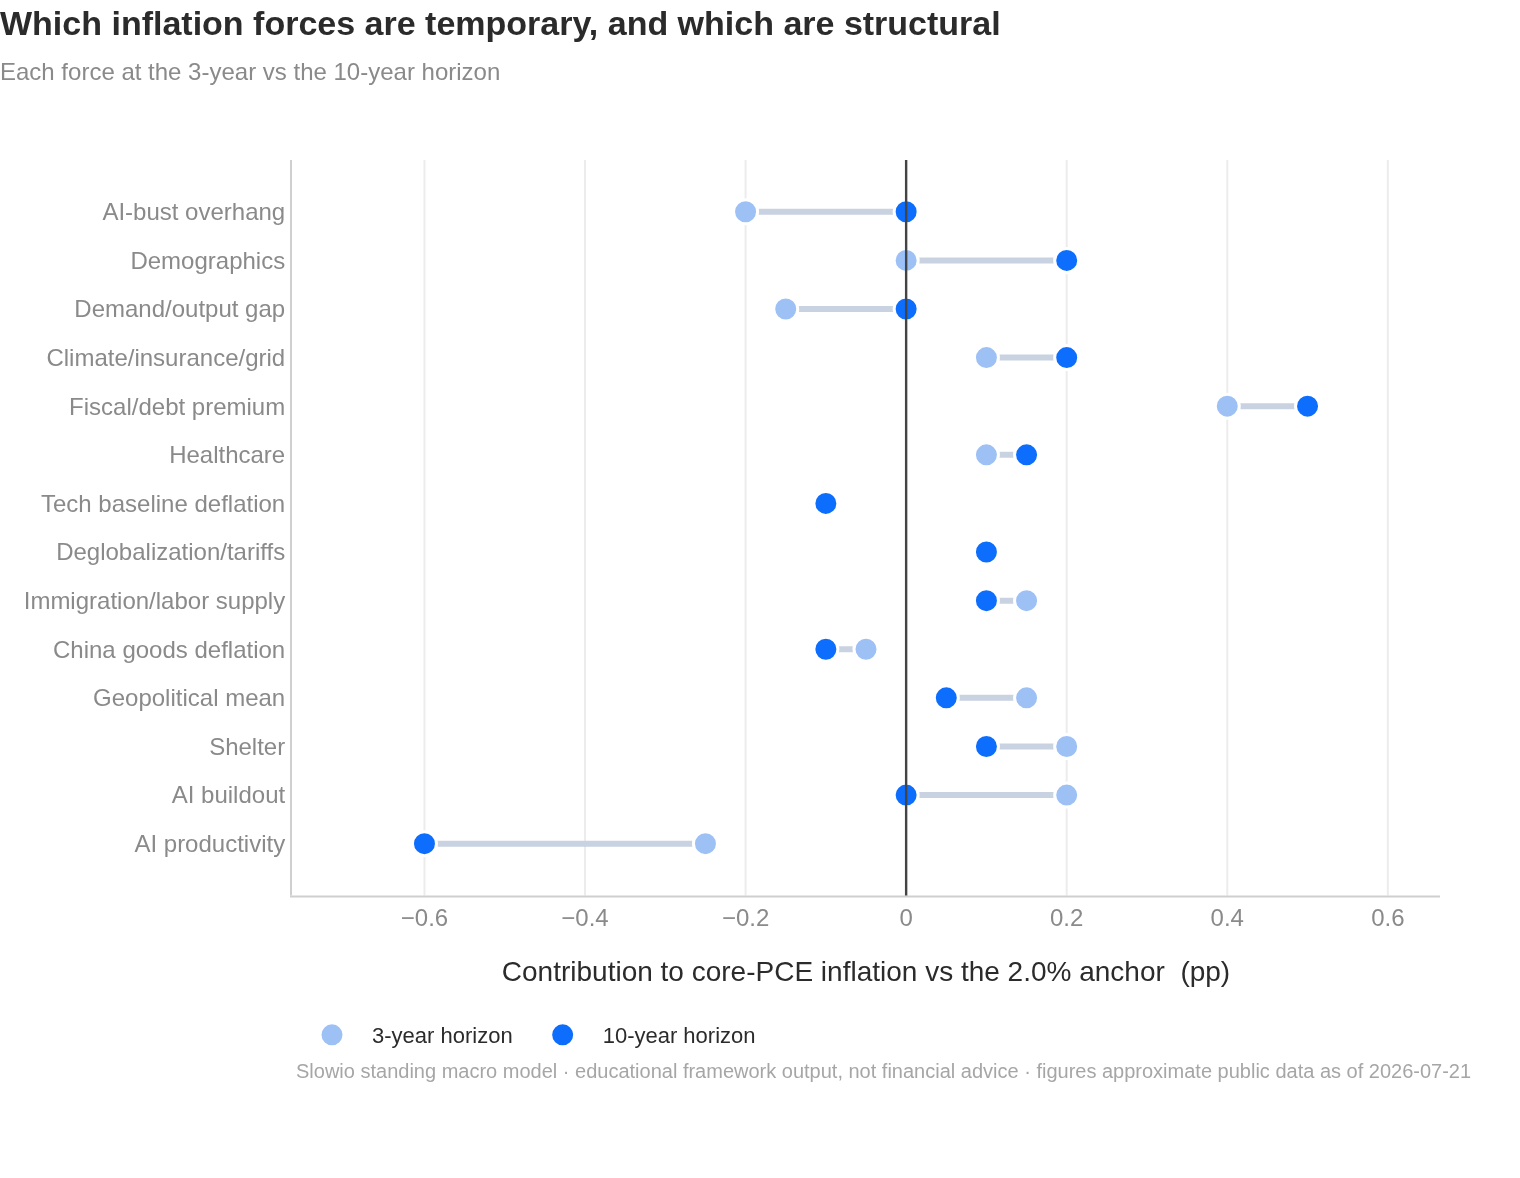
- AI-bust overhang 3y −0.15 → −0.20 (+0.05 to the downside weight): the AI/chip selloff and the capex-to-revenue gap narrative intensified into earnings week, raising near-term air-pocket risk. Hyperscaler capex now consumes 94% of operating cash flows after dividends and buybacks, and AI services generate only about $25 billion in direct revenue — roughly 4% of what's being spent.
- Geopolitical mean 3y +0.10 → +0.15 (+0.05): the Iran ceasefire fractured with sustained US strikes and Hormuz disruption, re-loading the near-term energy/inflation tail.
All other weights unchanged (moves < 0.05pp). Verdict: model moved (marginally) — ledger E[core PCE, 3y] nudges 2.65 → 2.70.
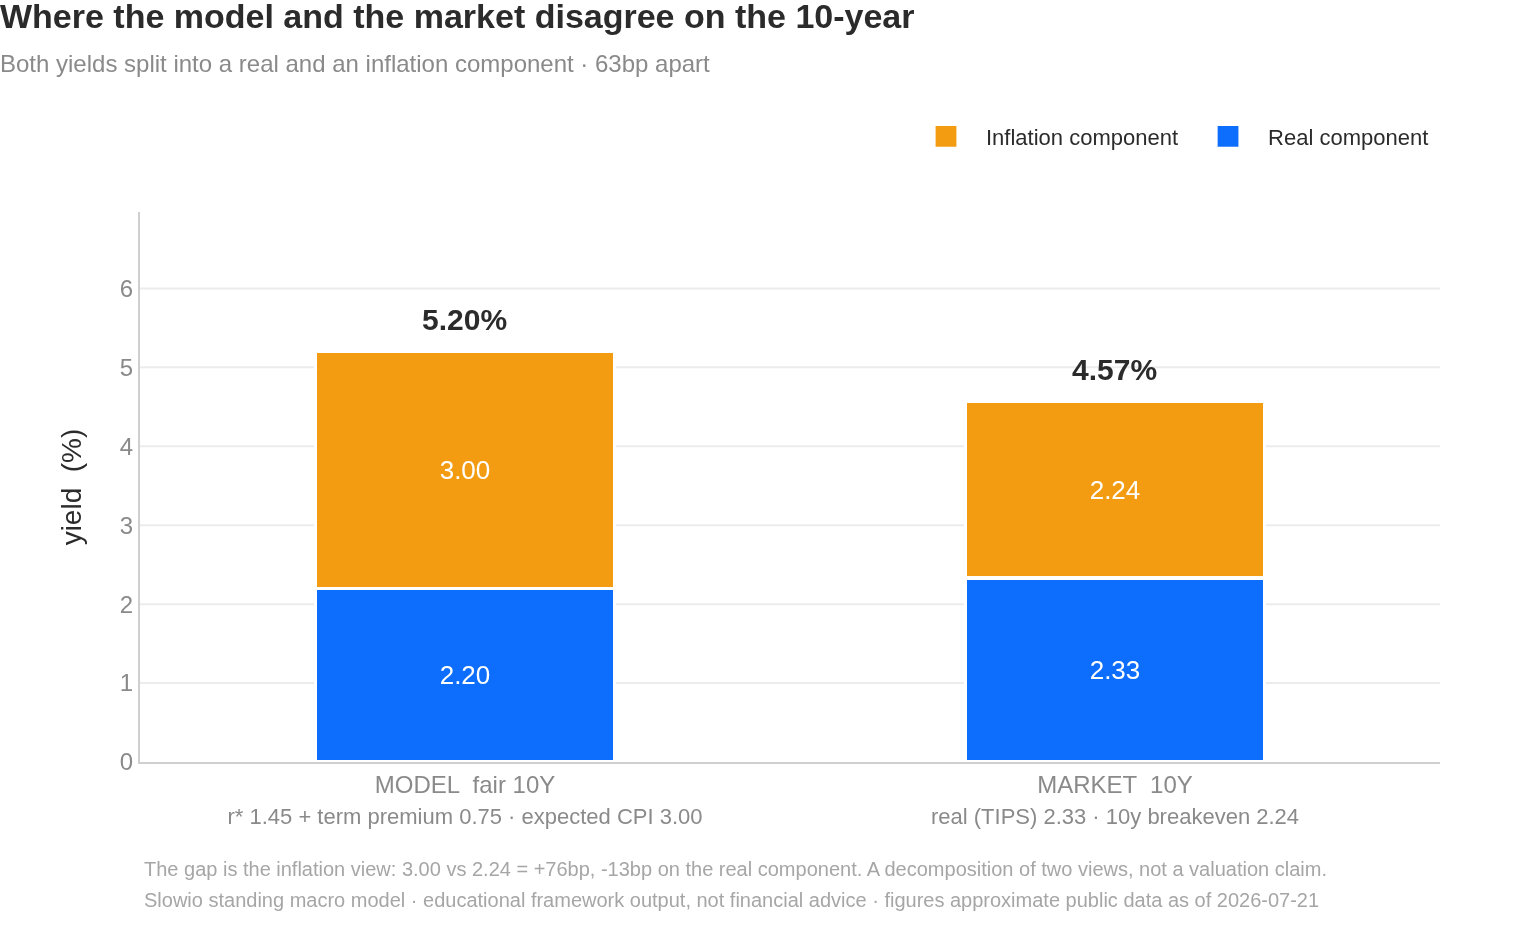
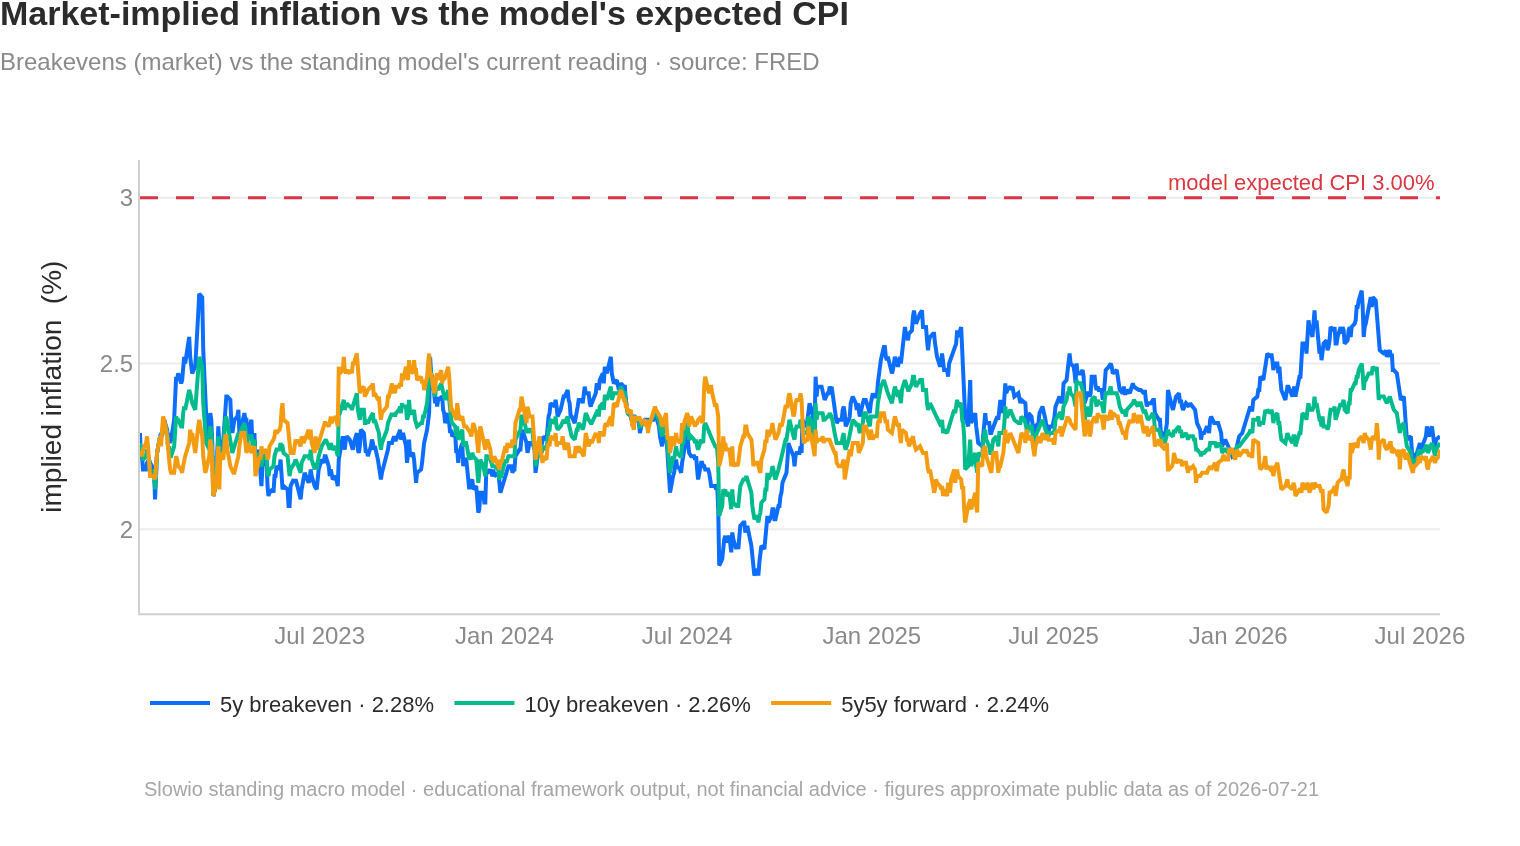
- Fair 10-year yield: model 5.20% vs market 4.57% (market minus model: -63bp) — in breach of the ±50bp line (fair above market)
- Model expected inflation, 3y: 2.70%
- Forward P/E vs model fair multiple: actual forward P/E ~+12% above the model-average fair P/E (fell back below the 25% line as equities compressed)
- Model expected returns, 3y: stocks -0.2%/yr · bonds +4.15%/yr
- Model expected returns, 10y: stocks +4.6%/yr · bonds +4.5%/yr
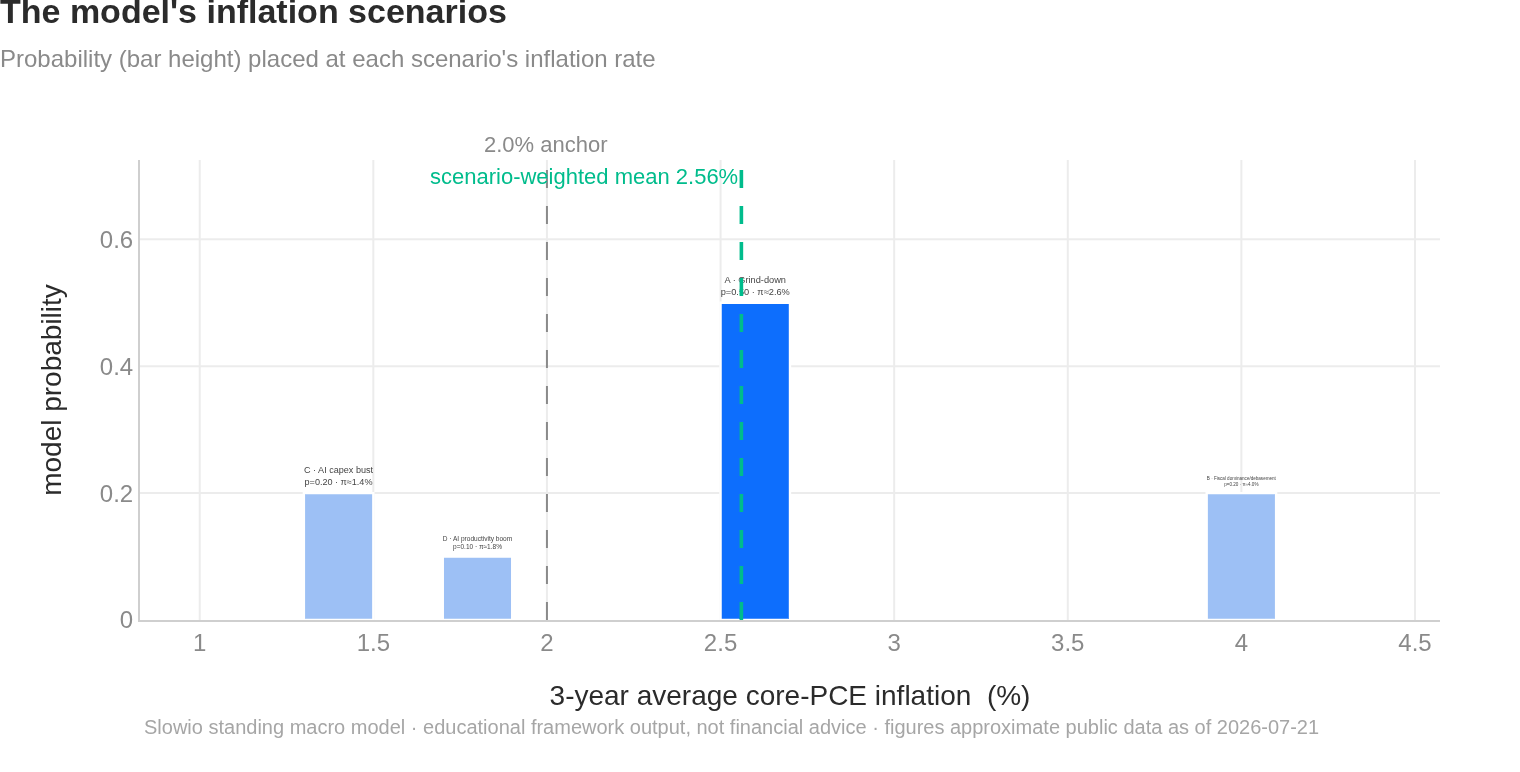
- Highest-probability scenario: Grind-down at 50% (inflation path ~2.6%)
Analytical framework output — educational tool only, not financial advice. Do your own research.