
Slowio maintains a standing quantitative model of US inflation and its implications for the risk-free rate and equity valuation, with a Europe & world readout, refreshed with sourced data roughly monthly. Each refresh, this digest records what moved since the prior run; the full report — force ledger, scenarios and sources — lives on the permanent Macro Outlook page. Analytical framework output — educational tool only, not financial advice.
This issue: the September 2026 refresh, covering what moved since the prior model run.
Surprises vs the prior state
- The Fed hiked. FOMC raised the target range to 3.75%–4.00% on 2026-09-16, vote 12-0 with no dissents (prior run: held at 3.50%–3.75%, 9-3). The new SEP has median fed funds 4.1% (2026), 4.1% (2027), 3.9% (2028), 3.6% (2029), 3.2% longer run; 16 of 18 officials see at least one more 25bp hike by end-2026; core PCE 3.4% (2026), 2.5% (2027), 2.2% (2028), 2.0% (2029), headline PCE 3.7% (2026); real GDP 2.3%/2.4%/2.2%/2.1%/2.0%; unemployment 4.1% throughout. Futures had priced >90% odds of the hike (Stifel). CME FedWatch pricing for the next three meetings is absent from the clippings — no substitute number this run.
- Inflation re-accelerated at the margin. August CPI +0.40% MoM / 3.4% YoY; core +0.29% MoM (3.5% annualized) / 2.4% YoY; core services +0.33% MoM (4.0% annualized), 3.0% YoY; supercore +0.31% MoM (3.7% annualized), 3.1% YoY (alt reading 2.99% YoY, "accelerated slightly"). Cleveland Fed September nowcasts: CPI 3.43%, core CPI 2.39%, PCE 3.89%, core PCE 3.49% YoY; Q3 SAAR 1.35% CPI / 2.16% core CPI / 2.44% PCE / 3.00% core PCE (core PCE SAAR up from 2.91% at the prior run). FRED gives July index levels only (core PCE 130.658, headline PCE 131.659) — no new PCE YoY print; the prior June readings (3.3% core / 3.7% headline) stand as the last actuals.
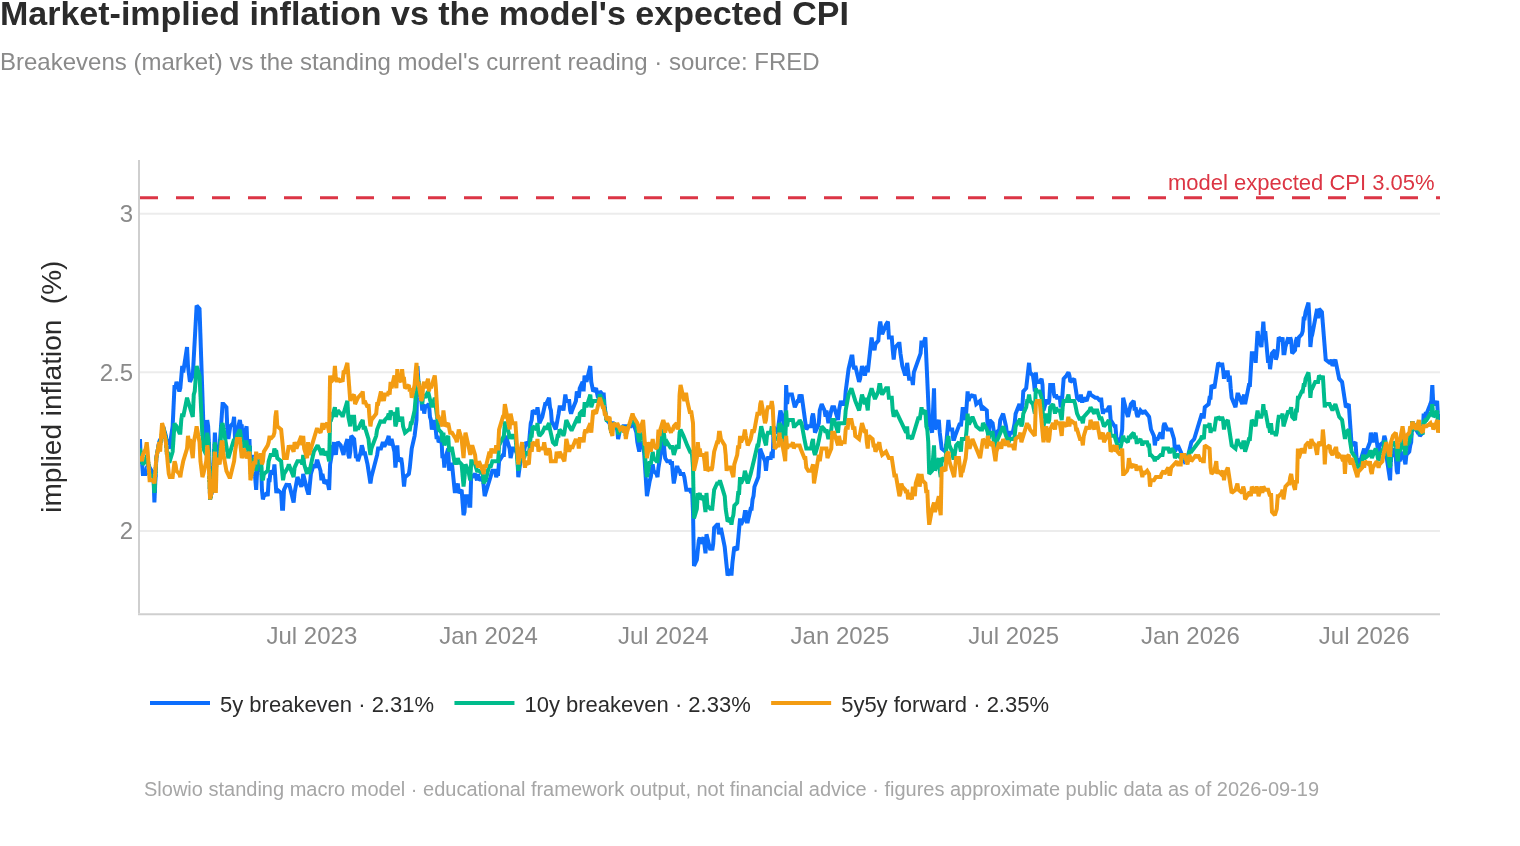
- Long rates broke higher. 10Y 4.94% (2026-09-17) vs 4.71% at the prior run (+23bp); Reuters notes the 10Y traded above 5% intraday and 4.958% post-announcement, with the 30Y at 5.312%–5.36%. 2Y absent — carried forward at 4.19% (2026-08-18), STALE and almost certainly obsolete after a 25bp hike. Breakevens: 10y 2.34% (9/2, from 2.30%), 5y 2.25% (8/17, from 2.28%), and 5y5y 2.34% (9/10) — new series (unavailable at the prior run).
- Oil repriced sharply higher. WTI $100.88 and Brent $103.77 (9/18, Reuters) vs $85.81/$91.87 prior; FRED WTI $107.02 (9/15), $101.27 (9/11), $91.48 (9/1). One forecast note quotes WTI $96.35 on 9/18 — dispersion flagged, Reuters used. Driver: fresh Saudi–Houthi cross-border strikes and damage to three East–West pipeline pumping stations.
- Equity multiples compressed. Forward P/E 19.1x (FactSet, 9/11; 19.11x dollarliquidity same date) vs 20.00 prior; trailing P/E 25.9x (FactSet, 9/11) vs 26.49 prior. Latest sourced index level is 7,686.14 (2026-08-31) — no September level in the clippings, so the level is stale by ~3 weeks; NTM EPS $394.16 (8/31), trailing EPS $292.00 (8/31); Q3 bottom-up EPS estimate $89.91, up from $88.64 on June 30. Equal-weight forward P/E unavailable.
- Tariffs: two-sided. US effective tariff on Chinese imports 22.8% (July), steel/aluminium 40.5%, with US–China talks on reciprocal cuts of ~$30bn of goods each side and possible removal of China's 15% LNG tariff ahead of the Sept 24 Xi visit. The overall US effective tariff rate is absent — carried at 7.1% (June), STALE.
- AI capex: BIS (9/16) reports data-center plans pointing to continued rapid growth in AI-linked business investment; no cuts or writedowns in the clippings. Absent and carried stale: CPI electricity, shelter CPI, average hourly earnings, immigration/labor-supply policy, China PPI/export prices, Treasury deficit/issuance news.
Ledger changes (all ≥ ±0.05pp listed)
| Force | Horizon | Prior → New | Justification |
|---|---|---|---|
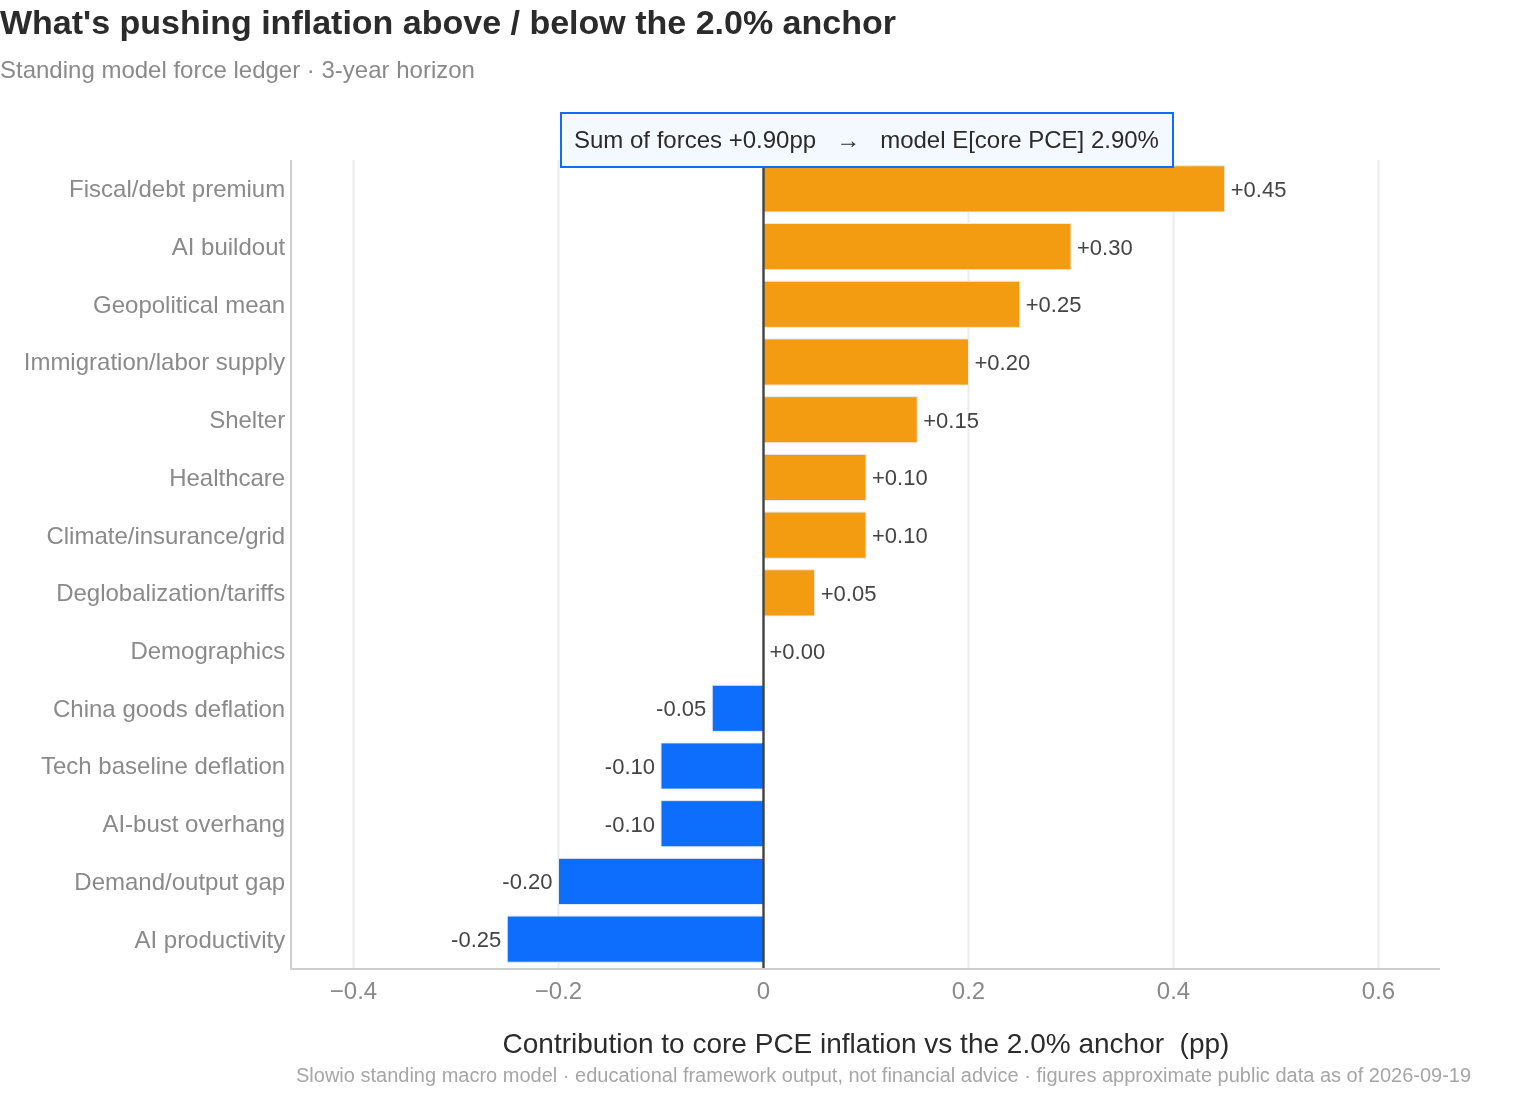
| Geopolitical mean | 3y | 0.20 → 0.25 | WTI/Brent up ~$15/$12 to $100.88/$103.77 with Saudi–Houthi strikes and pipeline pumping-station damage. |
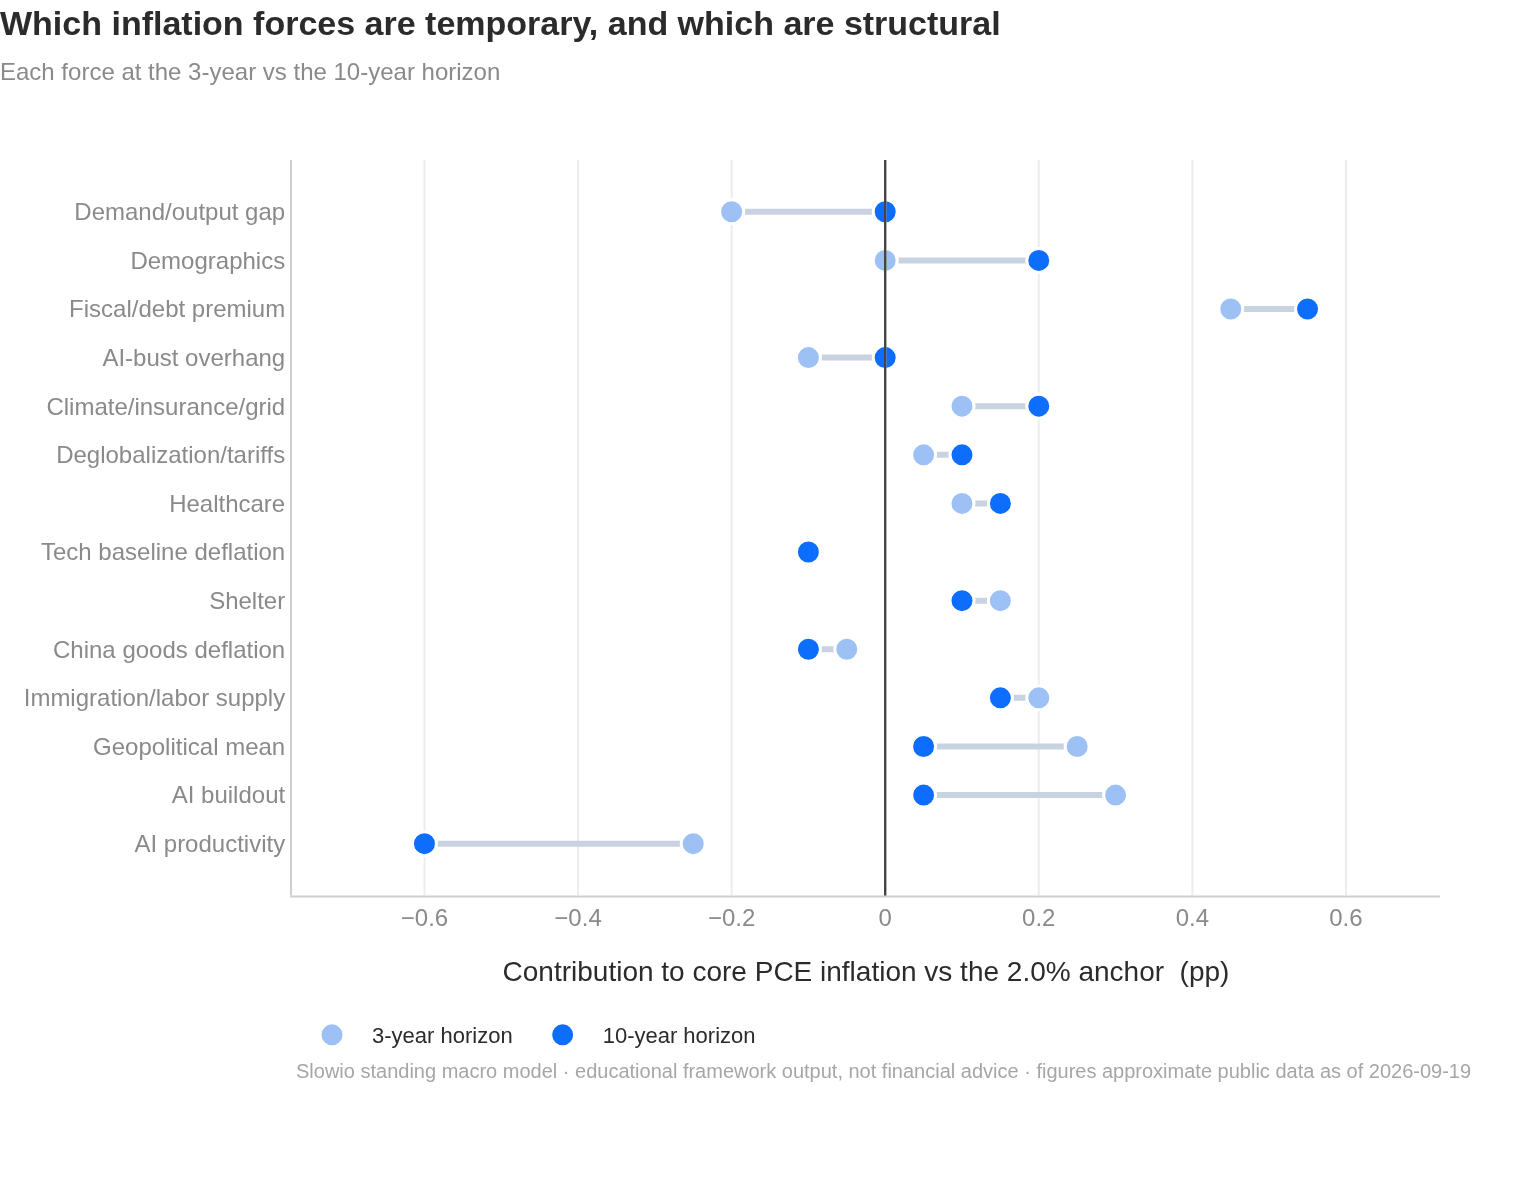
| Geopolitical mean | 5y | 0.10 → 0.15 | Same shock, now with damaged export infrastructure rather than a pure flow disruption. |
| AI buildout | 3y | 0.25 → 0.30 | BIS: data-center plans imply continued rapid growth in AI-linked investment, high-tech investment rising rapidly. |
| AI-bust overhang | 3y | −0.15 → −0.10 | No capex cuts, cancellations or writedowns in the clippings; less near-term disinflationary overhang. |
| Demand/output gap | 3y | −0.25 → −0.20 | SEP medians: 2.3%/2.4% real GDP with unemployment flat at 4.1%, and Aug core services CPI at a 4.0% annualized pace — less slack than assumed. |
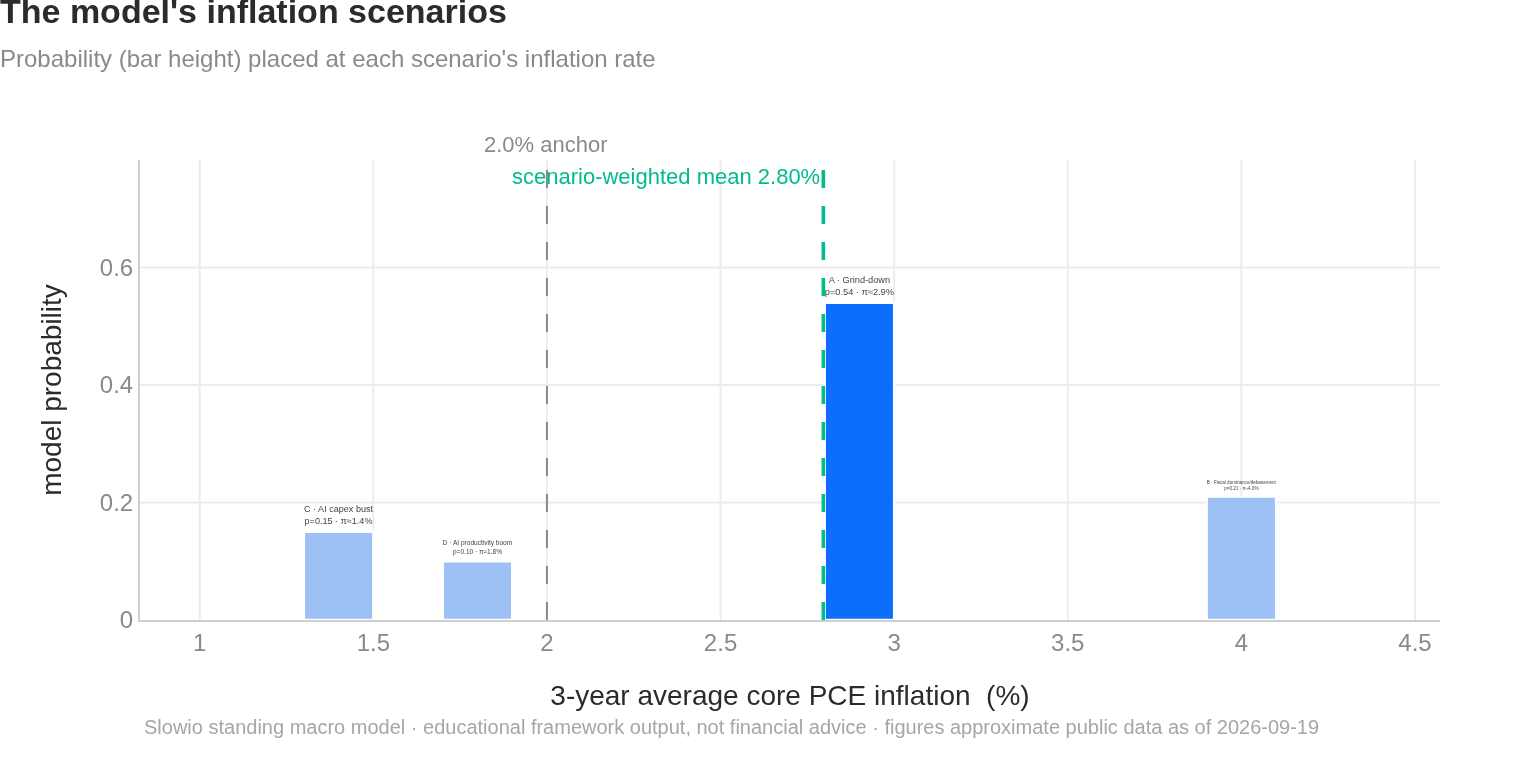
Scenario changes: B 0.24 → 0.21 (−3pp): unanimous 12-0 hike, 16/18 dots seeing further tightening and a 10y breakeven of 2.34% (well below the 2.6% trigger) all argue against near-term fiscal-dominance/debasement; A absorbs the residual at 0.54. Scenario A's central inflation is re-marked from ~2.8% to ~2.9% to keep ledger and scenario paths inside the 0.15pp cross-check, reflecting August core-services reacceleration and SEP core PCE of 2.5% in 2027 with 2% not reached until 2029. C held at 0.15, D at 0.10.
Verdict: model moved — 3y ledger inflation up 0.20pp, fair 10Y up 5bp, actual 10Y up 23bp, fair-vs-market gap now inside the tolerance band.
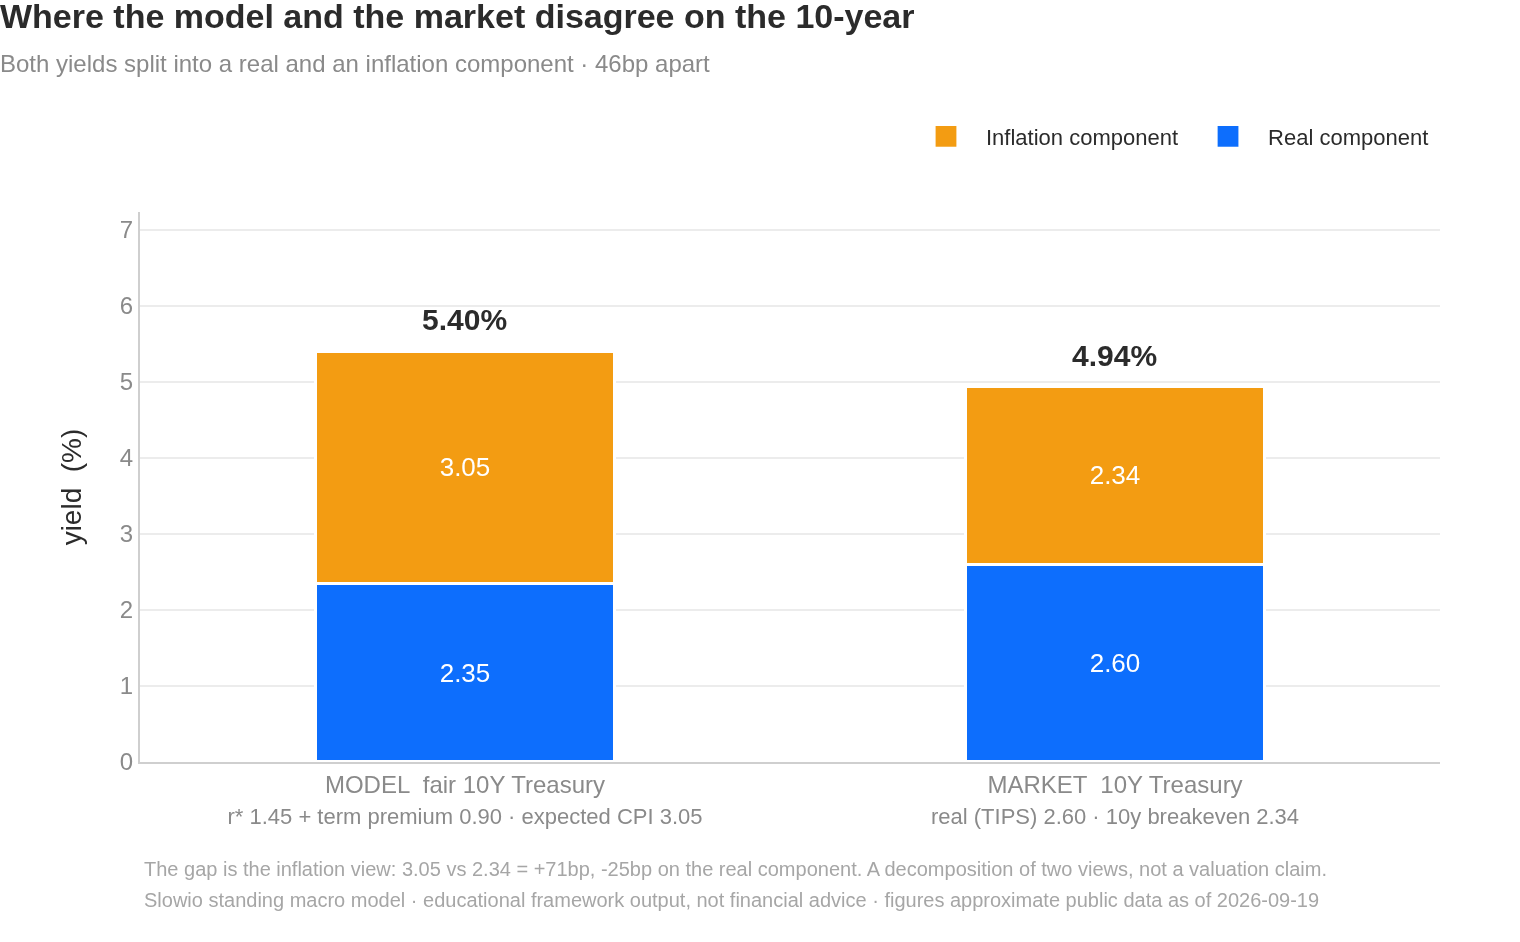
- Fair 10-year yield: model 5.40% vs market 4.94% (market minus model: -46bp) — FLIP: back inside the ±50bp line (fair above market) from -64bp, as the 10Y rose 23bp to 4.94% while the term premium was raised to 0.90%
- Model expected inflation, 3y: 2.90% ledger / 2.80% scenario-weighted
- Forward P/E vs model fair multiple: actual forward P/E 19.1 (FactSet 9/11) is ~+19% above the model-average fair P/E of 16.1 (prior +23%)
- Model expected returns, 3y: stocks +2.5%/yr · bonds +4.8%/yr
- Model expected returns, 10y: stocks +5.7%/yr · bonds +5.0%/yr
- Highest-probability scenario: Grind-down at 54% (inflation path ~2.9%)
Europe & world
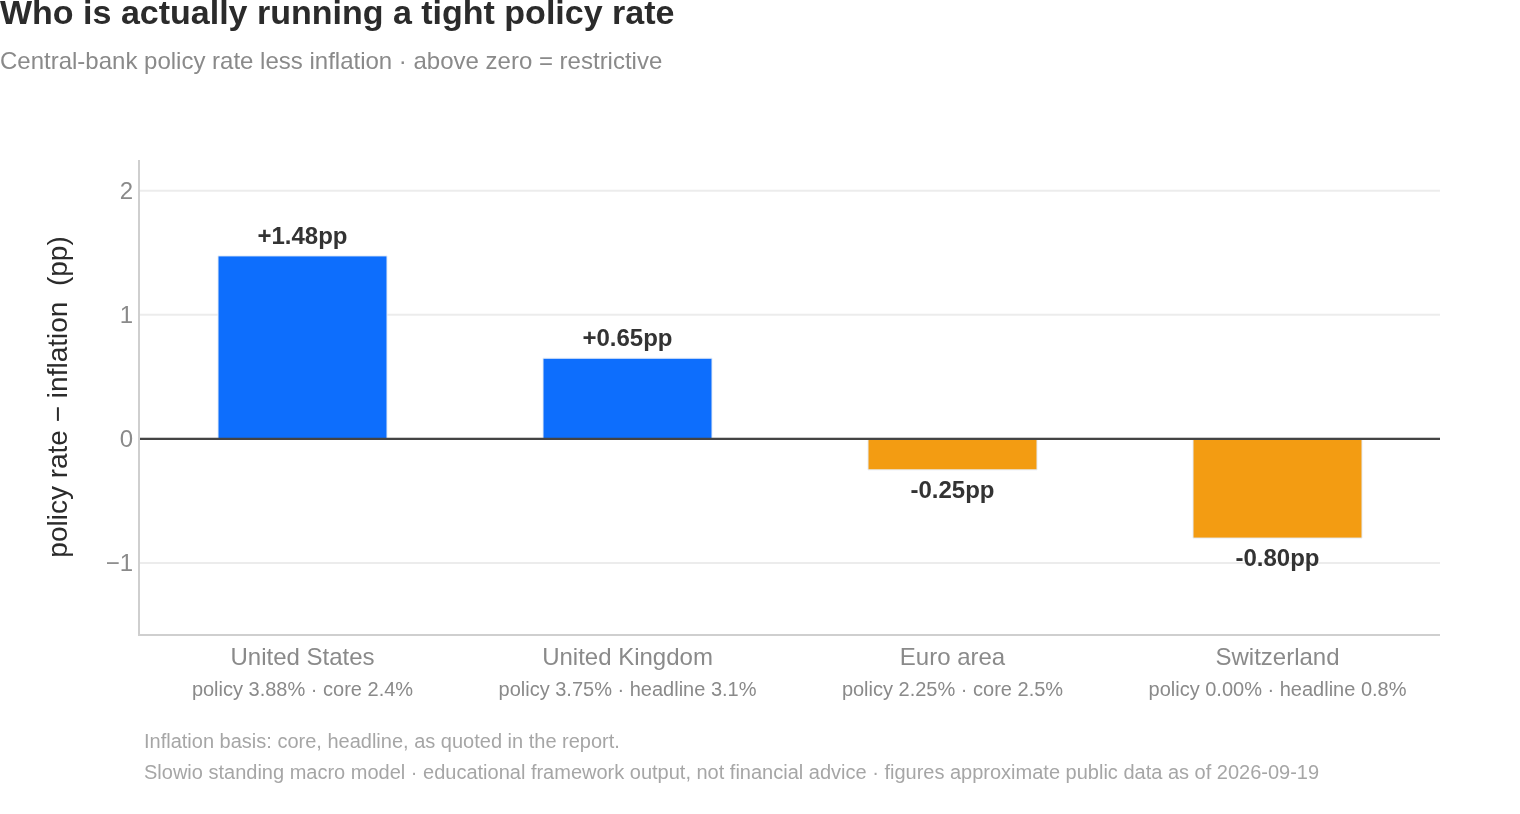
Euro area. ECB deposit rate 2.25% (9/19), MRO 2.40%, marginal lending 2.65% — unchanged vs prior; a second page from the same provider quotes 2.00%, discrepancy flagged, 2.25% used. Headline/core HICP YoY are not stated in the clippings (only the HICP index, 103.22, 2015=100) — carried at 2.9%/2.5% (July 2026), STALE. Market pricing of the next ECB move is unavailable this run (the prior carried ">90% Sept hike" note is dropped as unverifiable); ECB September staff projections assume the euro-area 10Y government yield at 3.1% (2026) rising to 3.5%/3.8%/4.0% in 2027–29 and EUR/USD at 1.13 (2026), 1.16 (2027-29). 10Y Bund 2.97% (9/19) — a fresh print that resolves the prior disputed 3.25%/2.17% pair, and sits ~28bp below the carried figure. BTP-Bund spread unavailable — carried ~80bp, STALE (no ≥20bp move can be confirmed). For European-listed issuers: financing benchmarks are anchored well below US ones (Bund 2.97% vs UST 4.94%), while staff projections embed a steadily rising cost of long-term euro debt through 2029.
Switzerland. CPI 0.8% YoY (August), up from the carried 0.4% (July) and 0.6% (May); SNB policy rate 0.00% (18 June 2026 assessment). EUR/CHF unavailable — carried 0.9334 (20.08.2026), STALE; the only USD/CHF datum is a consensus target of 1.075 (range 1.04–1.12), which is not reconcilable with the prior spot of 0.7979, so the prior spot is carried STALE and the forecast is flagged as disputed. Strong-franc pressure can therefore be neither confirmed nor refuted this run; Swiss exporters' translation effects remain the open variable.
UK. CPI 3.1% YoY (August), up from 2.9% (July); core unavailable — carried 2.6%, STALE. Bank Rate held at 3.75% on 16 September, 6-3; the September Market Participants Survey median sees 3.75% through mid-2027, with a 4.00% 75th percentile later. Gilt 10Y not in the clippings — carried 3.68%, STALE. UK-listed firms face an unchanged policy rate with headline inflation drifting up 0.2pp.
Japan & China (global forces). BoJ raised to 1.25% (18 September, 31-year high, two dissents), up from the carried 1.00%; USD/JPY 156.91; 10Y JGB unavailable — carried ~2.85%, STALE. A second BoJ hike with repatriation risk keeps upward pressure on global long yields, consistent with the 23bp rise in the US 10Y and the 30Y above 5.3%. China: no PPI/export-price data this run (goods-deflation force unchanged), but the US effective tariff on Chinese goods is 22.8% (July) with reciprocal cuts on ~$30bn each side under discussion before the Sept 24 summit — a two-sided input for European importers' landed costs and for competition from redirected Chinese goods.
Analytical framework output — educational tool only, not financial advice. Do your own research.