
Slowio maintains a standing quantitative model of US inflation and its implications for the risk-free rate and equity valuation, refreshed with sourced data roughly monthly. Each refresh, this digest records what moved since the prior run; the full report — force ledger, scenarios and sources — lives on the permanent Macro Outlook page. Analytical framework output — educational tool only, not financial advice.
This issue: the August 2026 refresh, covering what moved since the prior model run.
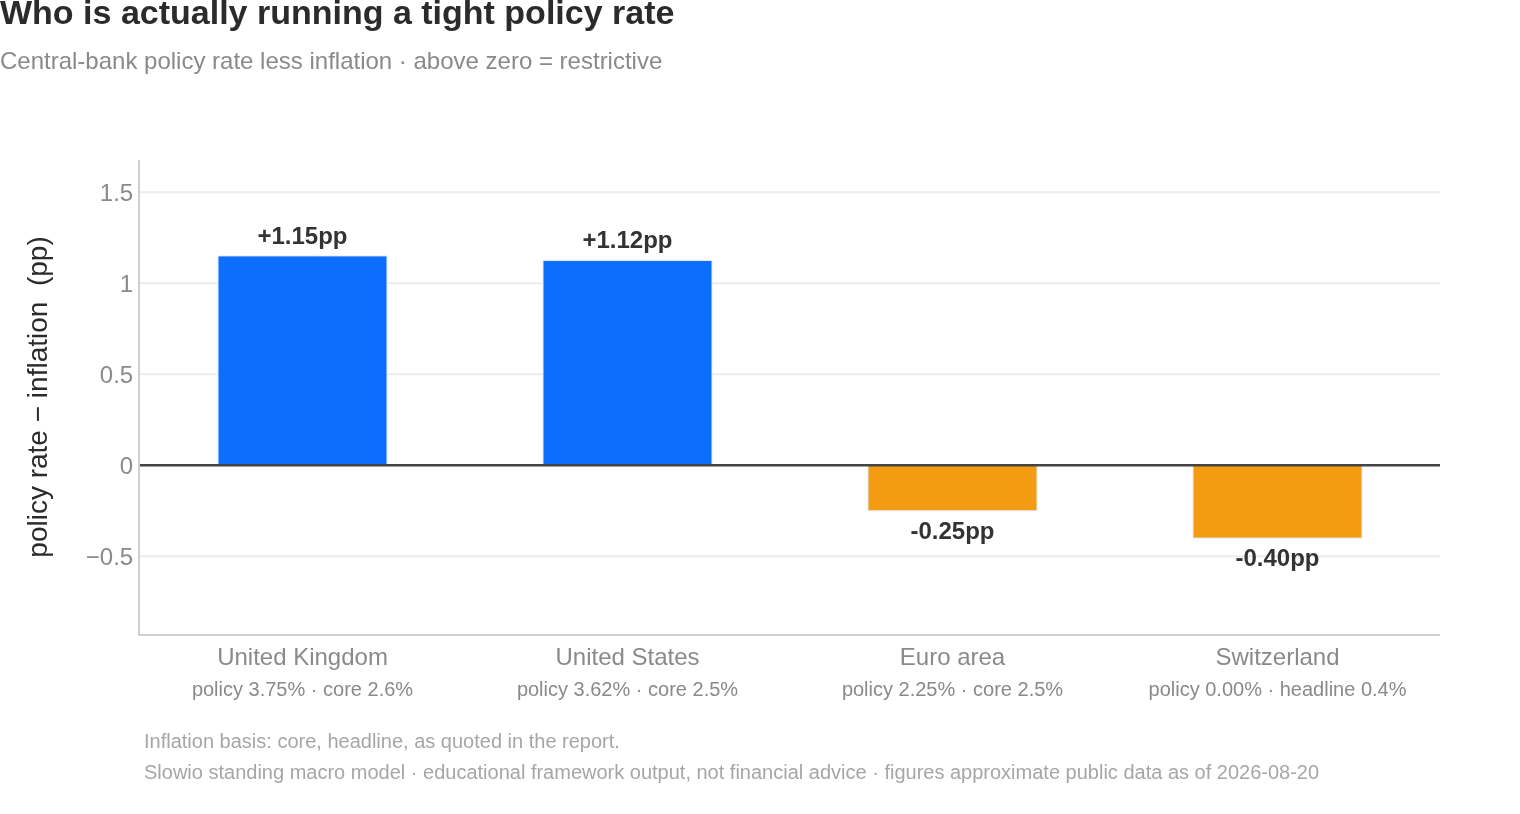
Data (new or confirmed this run). July CPI confirmed at 3.4% y/y headline / 2.5% core, MoM +0.1% / +0.2% (Cleveland Fed; BLS). June PCE 3.7% headline, core PCE 3.3% (BEA) — both unchanged. Cleveland Fed nowcasts (updated 08/20) put August CPI at 0.35% MoM / 3.36% y/y, core CPI 0.20% / 2.38%, PCE 0.34% / 3.73%, core PCE 0.27% / 3.34% (July core PCE nowcast 3.29%); the 2026:Q3 annualized nowcasts are much softer — CPI 1.16%, core CPI 1.91%, PCE 2.33%, core PCE 2.91% SAAR. A 3-month annualized CPI print and a supercore-services figure are not in this run's clippings (cpichart describes the concept only) — unavailable, no number supplied.
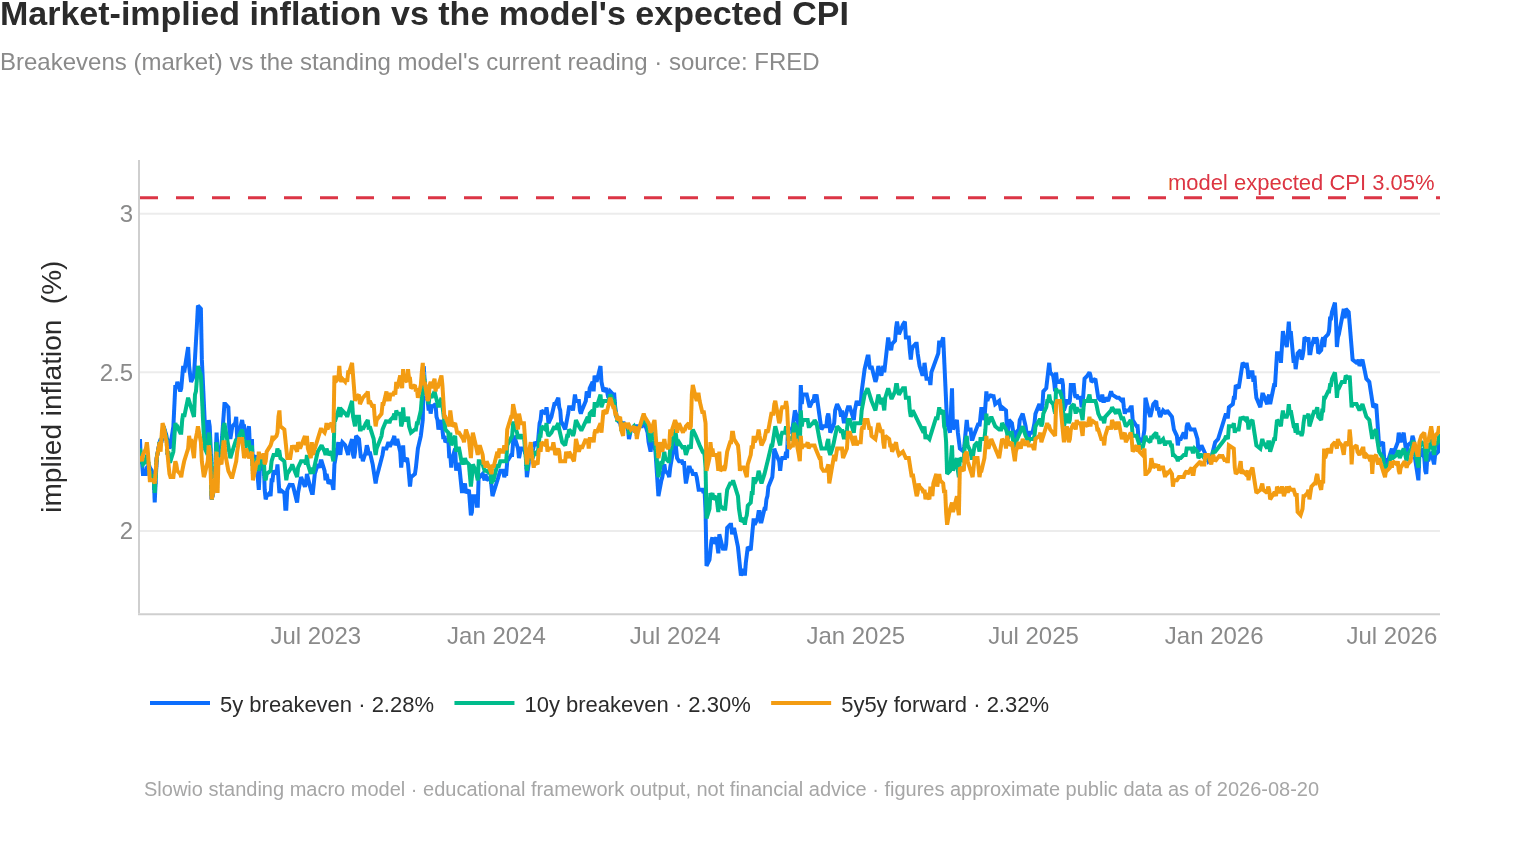
Market-implied. 10y breakeven 2.30% (8/18, from 2.28%), 5y breakeven 2.28% (8/19, from 2.21% — +7bp). 5y5y forward: unavailable this run. 10Y 4.71% (8/18, +6bp vs prior 4.65%), 2Y 4.19%.
Fed. Target range 3.50–3.75%, held 9–3 on 7/29 (dissents Hammack, Kashkari, Logan, all for +25bp); IORB 3.65%, primary credit 3.75%, ON RRP 3.50%. July minutes (8/19): officials saw a need to hike if inflation does not cool, and most now expect a September hike. CME FedWatch numbers are absent this run; a non-CME tracker shows Sept 16 hike probability 34.4%, Oct 28 15.6%, Dec 9 14.0% (next-meeting 37%, EFFR 3.630%) — that tracker's implied-rate column (3.13%/3.10%/3.06%, i.e. −50 to −58bp vs EFFR) is internally inconsistent with a 37% hike probability and is not used. Prior ~42% Sept-hike pricing therefore reads modestly lower on the substitute source. No FOMC since the prior run, so no new SEP (dot plot also flagged missing).
Equities. S&P 500 7,693 (8/18 close; 7,710 in the FactSet report) vs ~7,715 prior. Forward P/E 20.00 (streetstats, FactSet, stockmarketperatio; Barron's 21.42 on a different estimate basis). Trailing P/E dispersion is wide: 26.49 (Barron's, the series used as trailing GAAP), 28.2 (FactSet), 29.65–29.71 (us500/multpl), 23.56 (streetstats). NTM EPS $384.63, TTM EPS $326.52 (streetstats) → implied NTM step-up +17.8%. Equal-weight forward P/E unavailable.
Forces. WTI $85.81, Brent $91.87 (5th straight gain, Hormuz risk); Hormuz flows near standstill vs ~20 mb/d pre-conflict, Gulf output 8.3 mb/d below pre-war, but IEA cut 2026 demand by 1.6 mb/d (Q2 −4.9, Q3 −2.8 mb/d). CPI energy −1.5% MoM / +14.7% y/y; shelter +0.1% MoM (~2/3 of the all-items rise). Tariffs: effective rate 7.1% (June), down from 11% late 2025 after the Feb 20 SCOTUS IEEPA ruling, with new levies announced late July; China effective 23.2%, steel/aluminium 40.9%, autos 13.2%; St. Louis Fed reports tariff inflation effects have stabilized. Deficit ~6% of GDP FY25/FY26 with debt/GDP near its WWII-era peak (Fed MPR). Yields "tumbled Wednesday following a Treasury Department announcement" (details truncated in the clipping). Hyperscaler AI-capex news, national AHE, CPI electricity and China PPI are all absent — prior readings carried forward flagged stale.
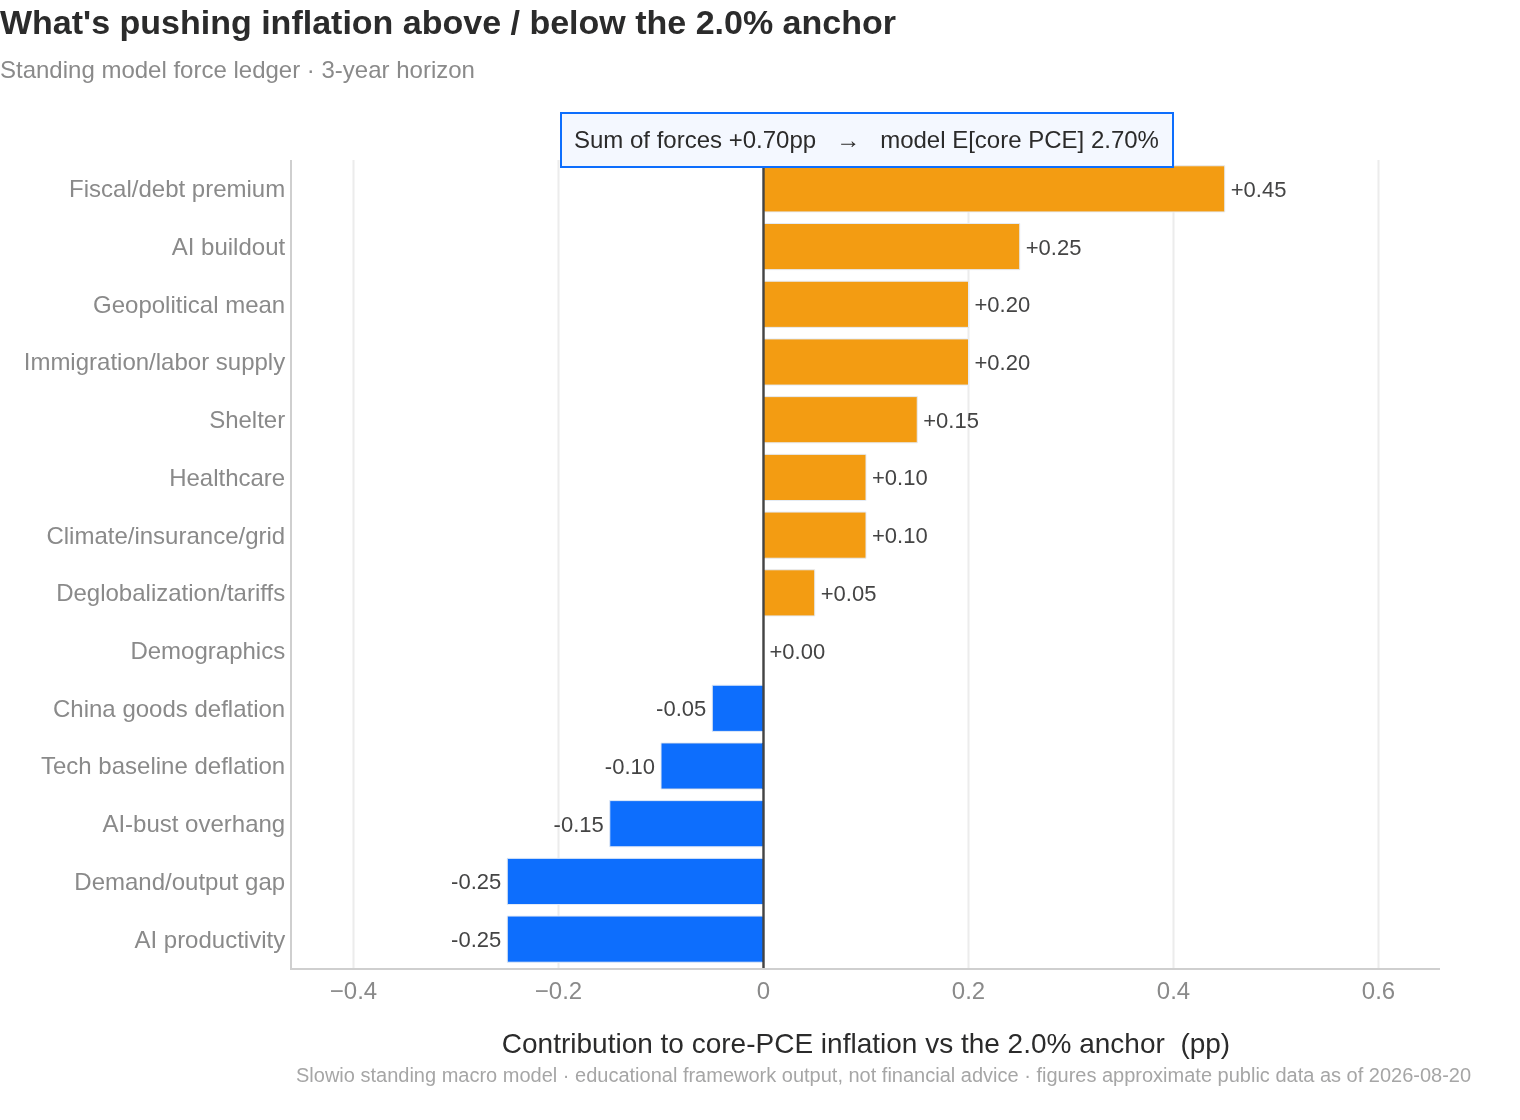
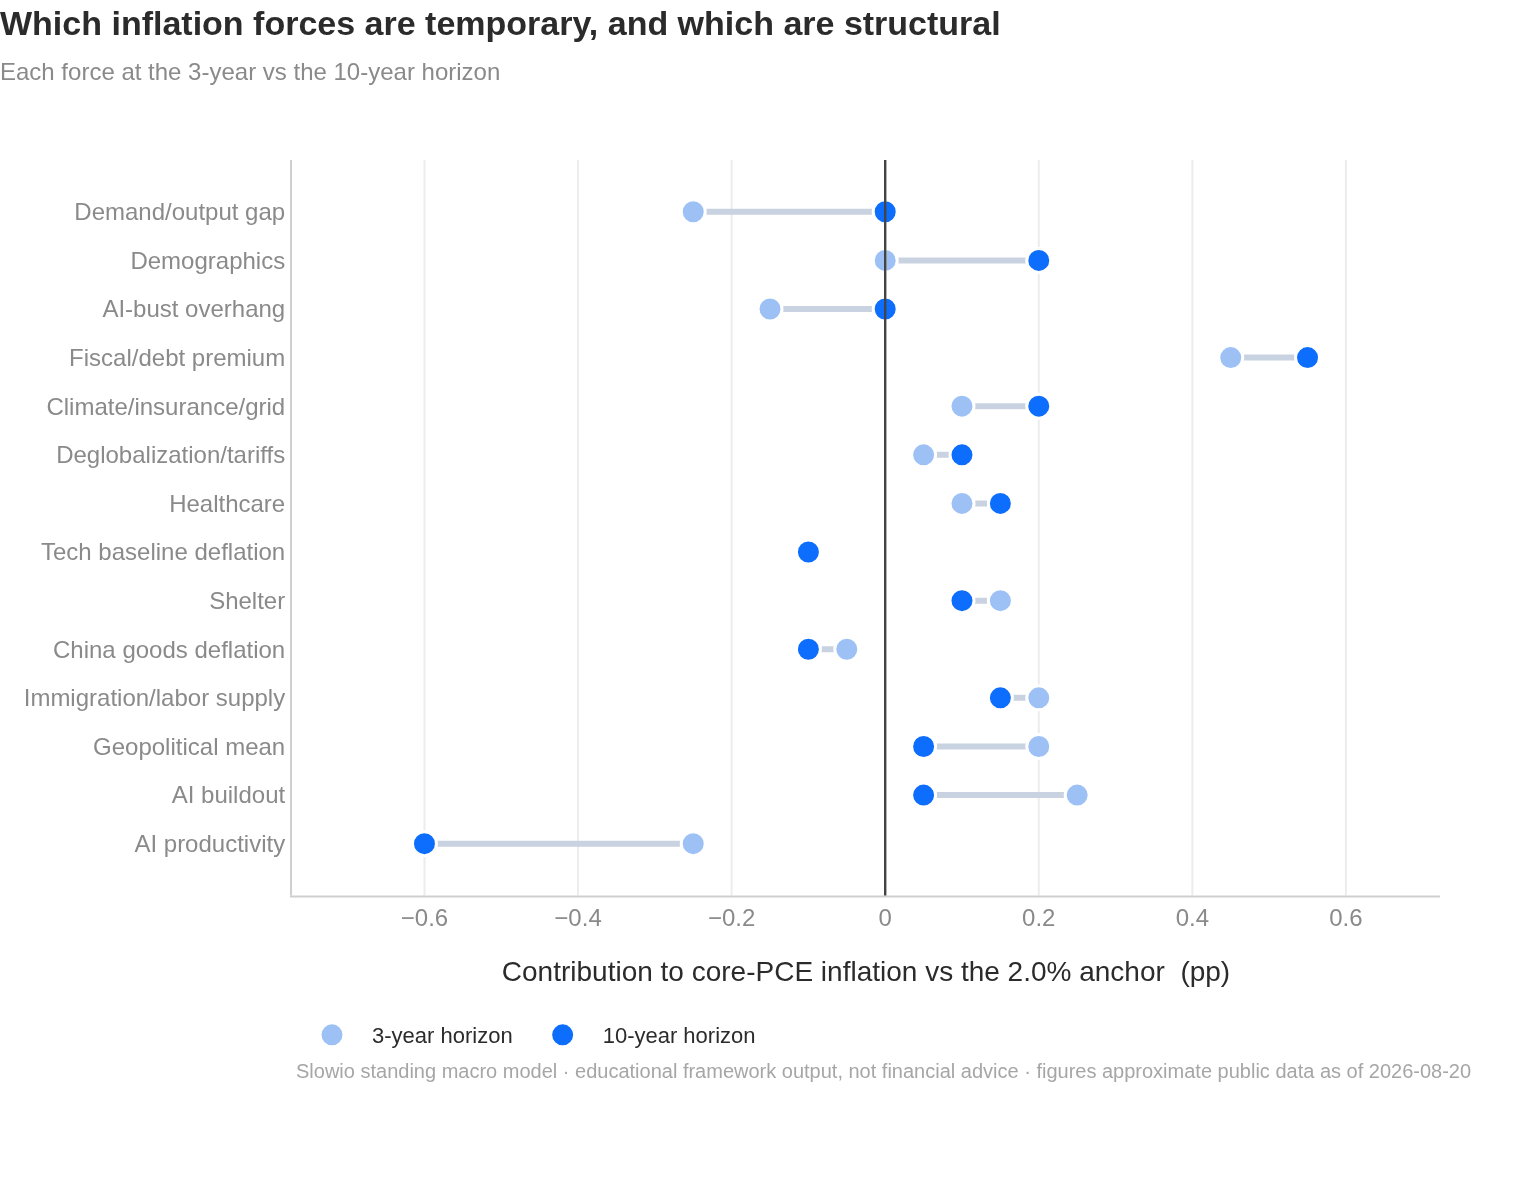
Ledger changes (both −0.05, 3y only).
- Deglobalization/tariffs 3y 0.10 → 0.05: measured effective tariff rate is 7.1% versus 11% in late 2025 and the St. Louis Fed finds tariff pass-through to inflation has stabilized.
- Demand/output gap 3y −0.20 → −0.25: the IEA's 1.6 mb/d demand downgrade plus Cleveland Fed Q3 core-PCE nowcast of 2.91% SAAR (vs 3.34% y/y) point to more near-term slack than the prior run assumed.
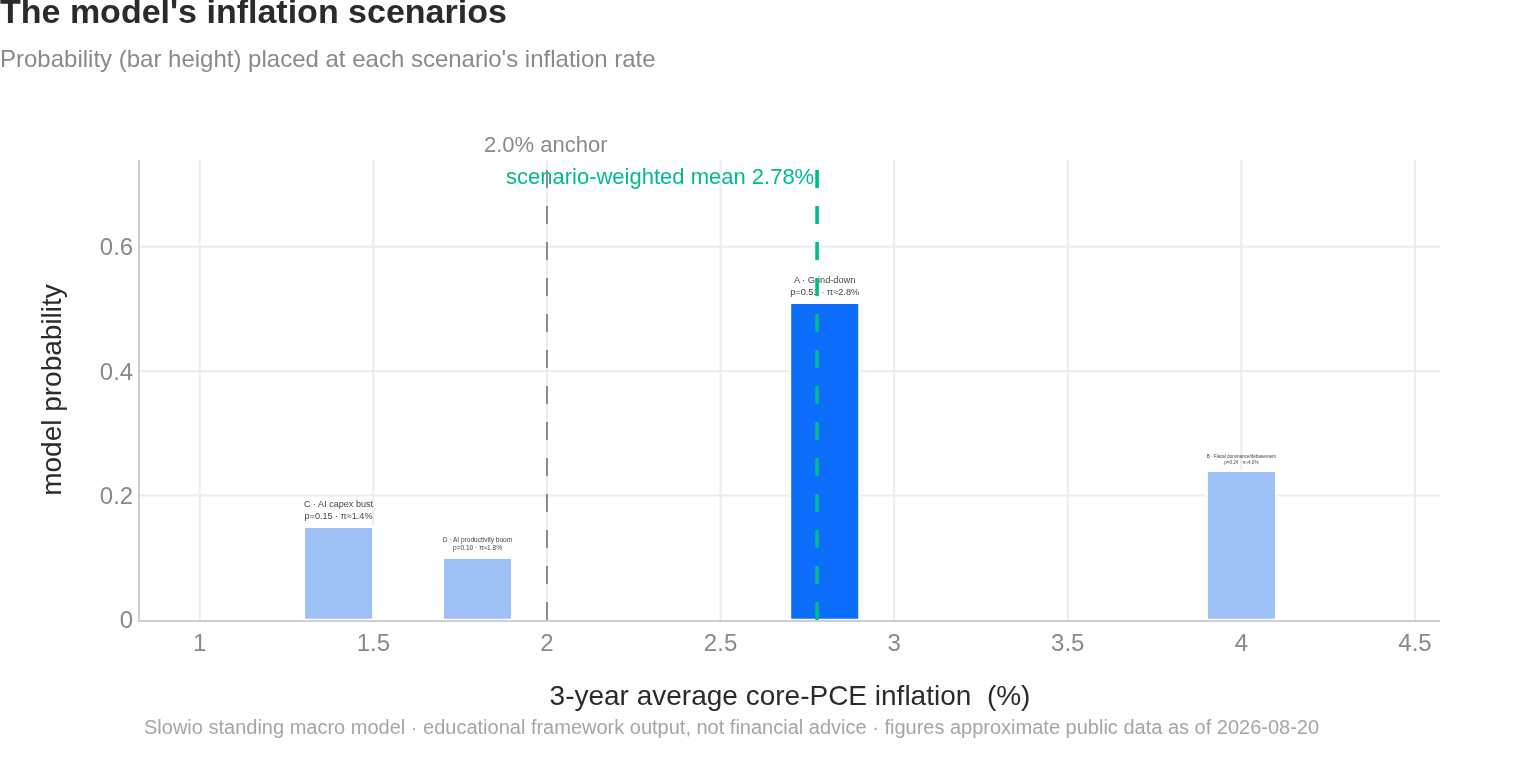
Scenario change. B 0.25 → 0.24, A 0.50 → 0.51 (<5pp, no justification required, but driven by the hawkish minutes and three hike dissents, which argue against near-term fiscal-dominance capture).
Verdict: model moved (marginally) — 3y ledger inflation 2.80% → 2.70%; 5y/10y unchanged.
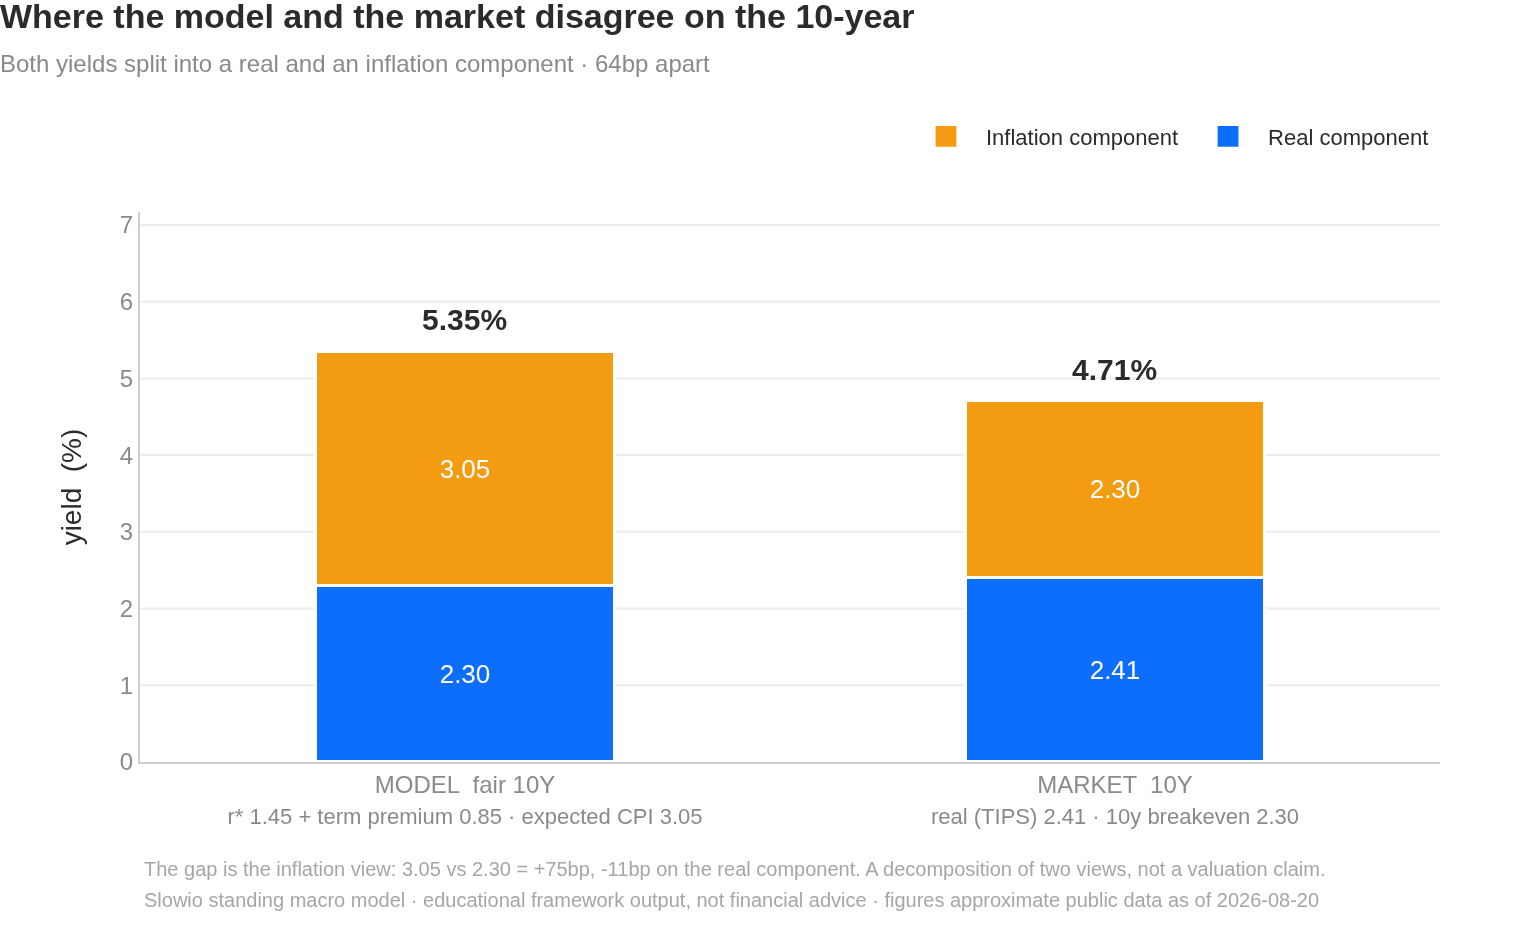
- Fair 10-year yield: model 5.35% vs market 4.71% (market minus model: -64bp) — still in breach of the ±50bp line (fair above market), narrowed from -70bp as the 10Y rose 6bp
- Model expected inflation, 3y: 2.70% ledger / 2.78% scenario-weighted
- Forward P/E vs model fair multiple: actual forward P/E 20.0 is ~+23% above the model-average fair P/E of 16.2 (below the 25% line, prior +20%)
- Model expected returns, 3y: stocks +1.9%/yr · bonds +4.6%/yr
- Model expected returns, 10y: stocks +6.2%/yr · bonds +4.7%/yr
- Highest-probability scenario: Grind-down at 51% (inflation path ~2.8%)
Analytical framework output — educational tool only, not financial advice. Do your own research.