
Slowio maintains a standing quantitative model of euro area inflation and its implications for Bund yields and European equity valuation, with a Switzerland, UK and world readout, refreshed with sourced data roughly monthly. Each refresh, this digest records what moved since the prior run; the full report — force ledger, scenarios and sources — lives on the permanent Macro Outlook Europe page. Analytical framework output — educational tool only, not financial advice.
This issue: the September 2026 refresh, covering what moved since the prior model run.
This is the first real run of this edition: the 2026-09-01 state was a seeded placeholder (uniform probabilities, zero weights, empty conclusions), so nothing below is a "delta" against a prior reading. Every weight, probability and conclusion is calibrated from this run's clippings.
The data set being calibrated against
- Inflation. Euro area flash HICP for August 2026: 3.3% YoY, +0.4% MoM, up from 2.9% in July and 2.8% in June (2.5% in March) — a 0.8pp climb in five months. Core (HICPX) 2.4%, all-items ex-energy 2.2%, services 3.0% (down from 3.3% in July, 3.2% in March). So the acceleration is energy-led, not core-led — core is 0.4pp above the 2.0% anchor, services momentum is easing.
- Official projections. ECB June 2026 baseline: HICP 3.0% (2026), 2.3% (2027), 2.0% (2028); HICPX 2.5% / 2.5% / 2.2%. That is a marked upgrade on the March round (HICP 2.6/2.0/2.1; core 2.3/2.2/2.1) — the staff themselves moved core up ~0.3pp for 2027.
- Energy. TTF gas €73.2–73.7/MWh, with an intraday print of €75.325/MWh, the highest since January 2023: +30.9% on the month, +125.9% on the year. Brent ~$95/bbl (+19.7% m/m, +41.8% y/y), WTI $90.43. EU storage 63–65% full, the lowest seasonal level since 2009. Drivers: renewed US–Iran fighting and Strait of Hormuz risk (~1/5 of global oil/LNG trade), Ukrainian drone strikes on Russian refineries, QatarEnergy force majeure on LNG to Edison (Italy) into early November. Partial offset: weekly average power prices fell across most European markets in late August (Nordic −20%, Portugal −17%).
- Policy. Sourced ECB rates: deposit facility 2.00%, MRO 2.15%, MLF 2.40% (5 Feb 2026 decision, described as reaffirmed at the 22–23 July meeting). Caveat: the July account refers to "rates kept unchanged after June hike", and the 2Y Schatz at 2.98% sits ~100bp above a 2.00% DFR — no post-June-hike policy level is sourced in this run's clippings, so the 2.00% figure is carried as the only verifiable level and flagged as possibly superseded. A September hike is >95% priced per the July account and Nagel; a further hike is fully priced by Feb 2027; ING expects +25bp in September; Šimkus (1 Sep) says the September hike is "not going to be enough" but rules out 50bp. Balance sheet: APP/PEPP running off with no reinvestment. Fiscal stance: slightly more expansionary in 2026, less contractionary in 2027; defence/infrastructure rollout supporting growth.
- Rates/equities. 10Y Bund 3.36%, 2Y Schatz 2.98%, OAT–Bund 80.4bp (31 Aug: OAT 4.11% / Bund 3.31%). STOXX Europe 600 646.32 (prev. close 645.91); Euro Stoxx 50 ~6,357–6,362. Multiples: forward P/E 15.37, trailing 19.67 (Siblis, as of 30 Jun 2026 — two months stale); one article cites 16x forward. NTM EPS growth: 5% (Goldman 2026 forecast) to ~10% (consensus, called a demanding bar).
- Not available this run (no number supplied): core 3-month annualized; negotiated wages; German/French/Italian/Spanish HICP; euro 5y5y forward inflation swap and 10y inflation-linked swap; BTP–Bund spread; EUR/USD; unemployment; US–EU tariff news; China export prices. Compensation per employee is used as the wage proxy (3.9% 2025 → 3.2% 2026/27/28).
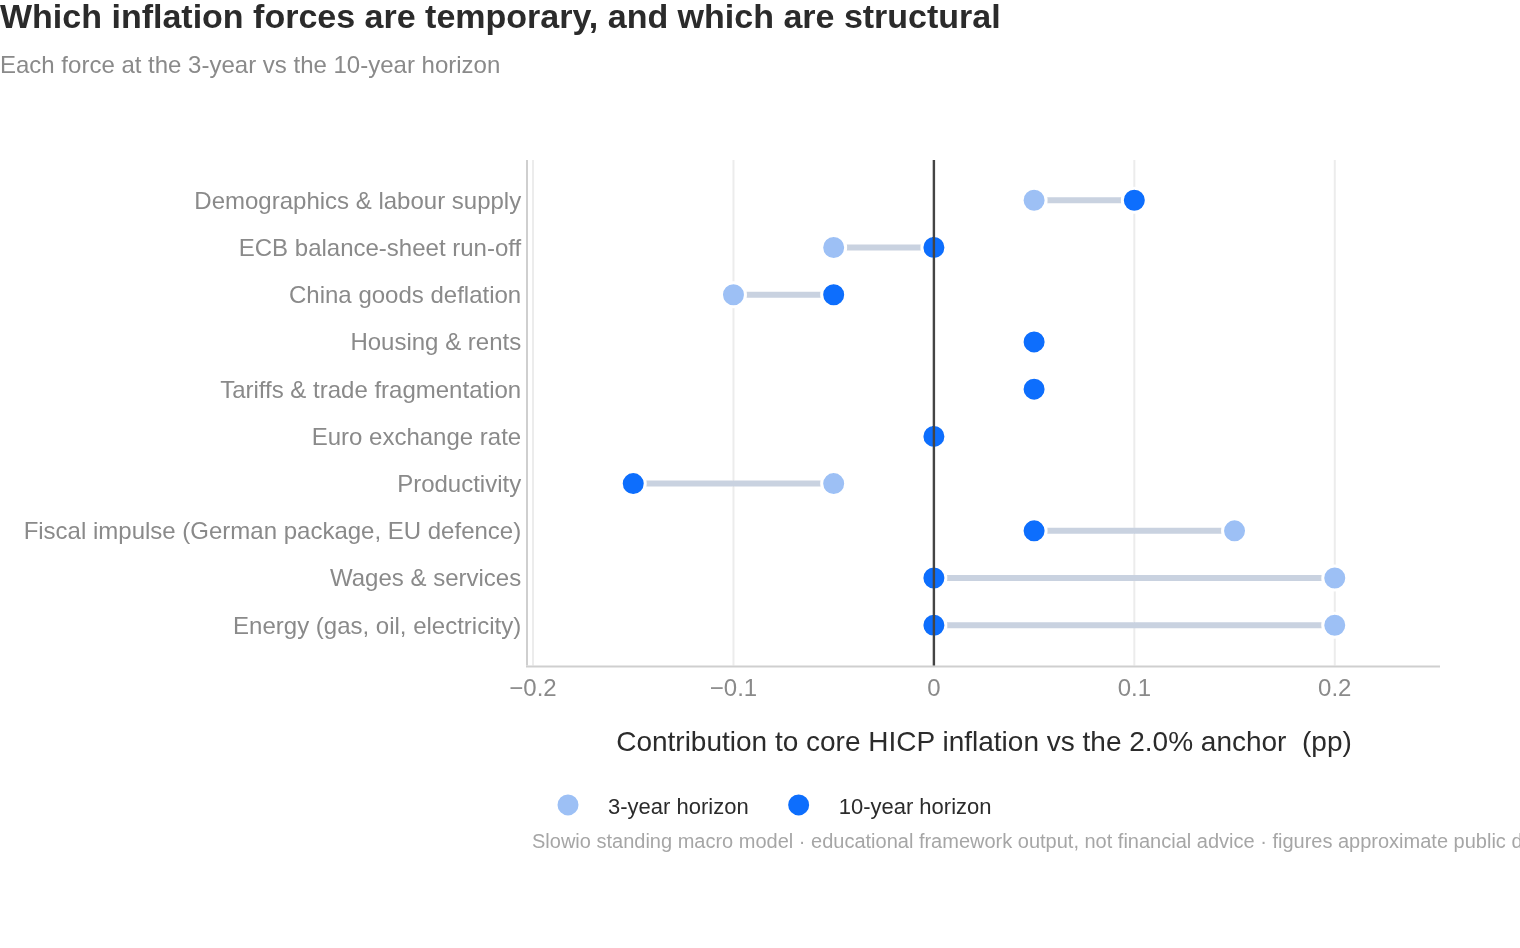
How each weight was set (deviation from the 2.0% core anchor, in pp):
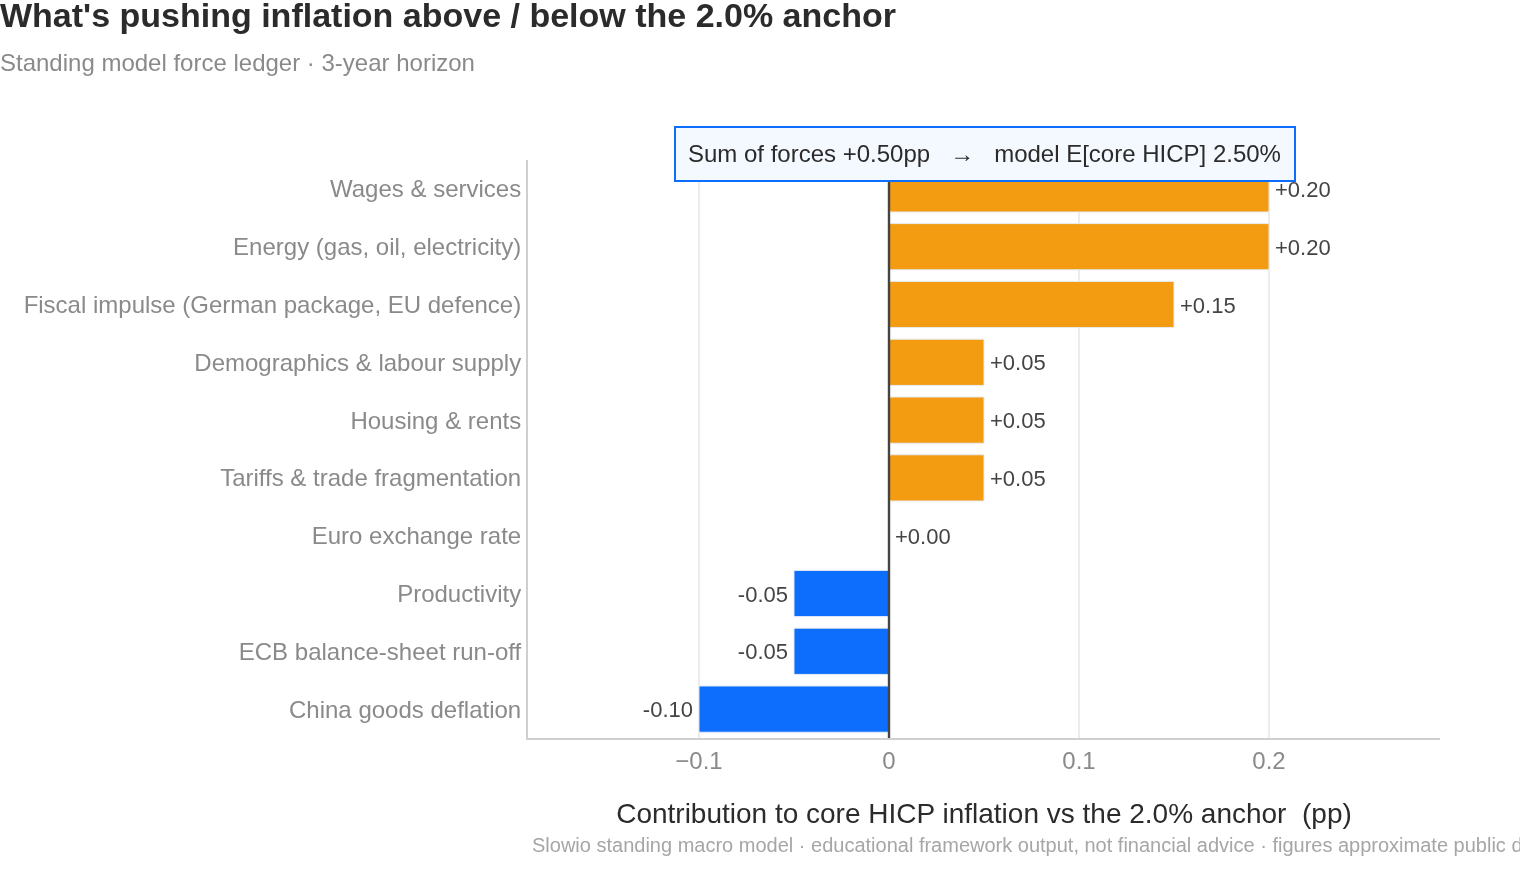
- Energy +0.20 / +0.10 / 0.00 — a 126% y/y TTF move and $95 Brent with storage at a 2009-low pass into core goods and services with a 2–4 quarter lag, but futures-implied shocks are level shocks, so it decays to zero by 10y.
- Wages & services +0.20 / +0.10 / 0.00 — services 3.0% and comp/employee 3.2% (≈2% + ~1% productivity) are mildly above anchor; the July→August drop from 3.3% to 3.0% argues against a larger weight.
- Euro exchange rate 0.00 / 0.00 / 0.00 — EUR/USD is absent from the clippings; DXY ~99.4–99.8 with the Fed likely hiking gives no measurable signal, so the force is set neutral and explicitly unquantified.
- Fiscal impulse +0.15 / +0.10 / +0.05 — ECB records the stance as slightly more expansionary in 2026 and less contractionary in 2027, with defence/infrastructure spending ramping.
- Tariffs & trade fragmentation +0.05 / +0.05 / +0.05 — no fresh tariff news this run; a small structural positive only.
- China goods deflation −0.10 / −0.10 / −0.05 — no China CPI/PPI or export-price data in the clippings; the standing structural disinflation is kept small precisely because it is unsourced this run.
- ECB balance-sheet run-off −0.05 / −0.05 / 0.00 — passive tightening continues with no reinvestment.
- Housing & rents +0.05 / +0.05 / +0.05 — sticky component, no new data.
- Demographics & labour supply +0.05 / +0.10 / +0.10 — shrinking labour force is a slow, back-loaded upward force.
- Productivity −0.05 / −0.10 / −0.15 — defence/infrastructure capex should lift measured productivity late in the horizon.
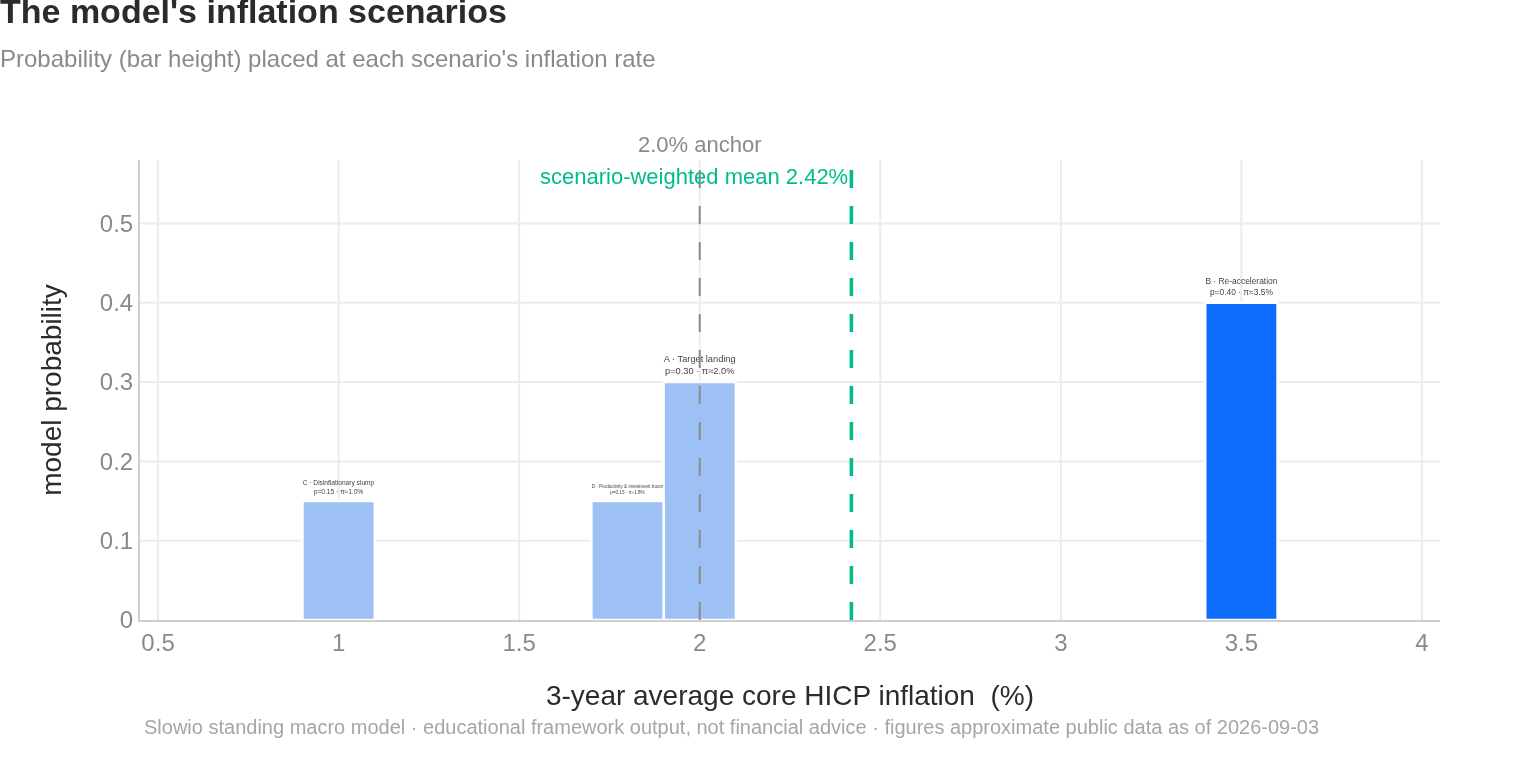
Scenario probabilities: B "Re-acceleration" set at 0.40 (headline 3.3% and rising, energy +126% y/y, Hormuz risk, two hikes priced, ECB staff core revised up, US PCE 3.7%); A 0.30 (core 2.4% and services decelerating, ECB restrictive); C 0.15 (no China deflation or EA activity data to support more); D 0.15 (capex rollout real but slow).
Verdict: model moved — initial calibration set (energy-led B-skew).
- Fair 10-year yield: model 3.48% (r* 0.40 + HICP 2.43 + TP 0.65) vs market 3.36% (2026-09-03) (market minus model: -12bp) — Actual 10Y Bund 12bp below model fair value — inside the +/-50bp flag; model-vs-inflation-swap gap not computable (euro 5y5y and 10y ILS absent from clippings).
- Model expected inflation, 3y: 2.50% core (ledger) / 2.42% (scenario-weighted); sigma 0.94pp; P(pi>3%) 34%, P(pi<1.5%) 21%
- Forward P/E vs model fair multiple: Actual forward P/E 15.37 (30 Jun 2026, stale) is 20.9% above the model-average fair 12.71; on the alternative sourced 16x figure the gap is 25.9%
- Model expected returns, 3y: stocks +3.8%/yr · bonds +2.6%/yr
- Model expected returns, 10y: stocks +7.1%/yr · bonds +3.1%/yr
- Highest-probability scenario: Re-acceleration at 40% (inflation path ~3.5%)
Switzerland, UK & world
First run carrying this block — the prior state has no "world" field, so no deltas are reportable; the values below become the baseline.
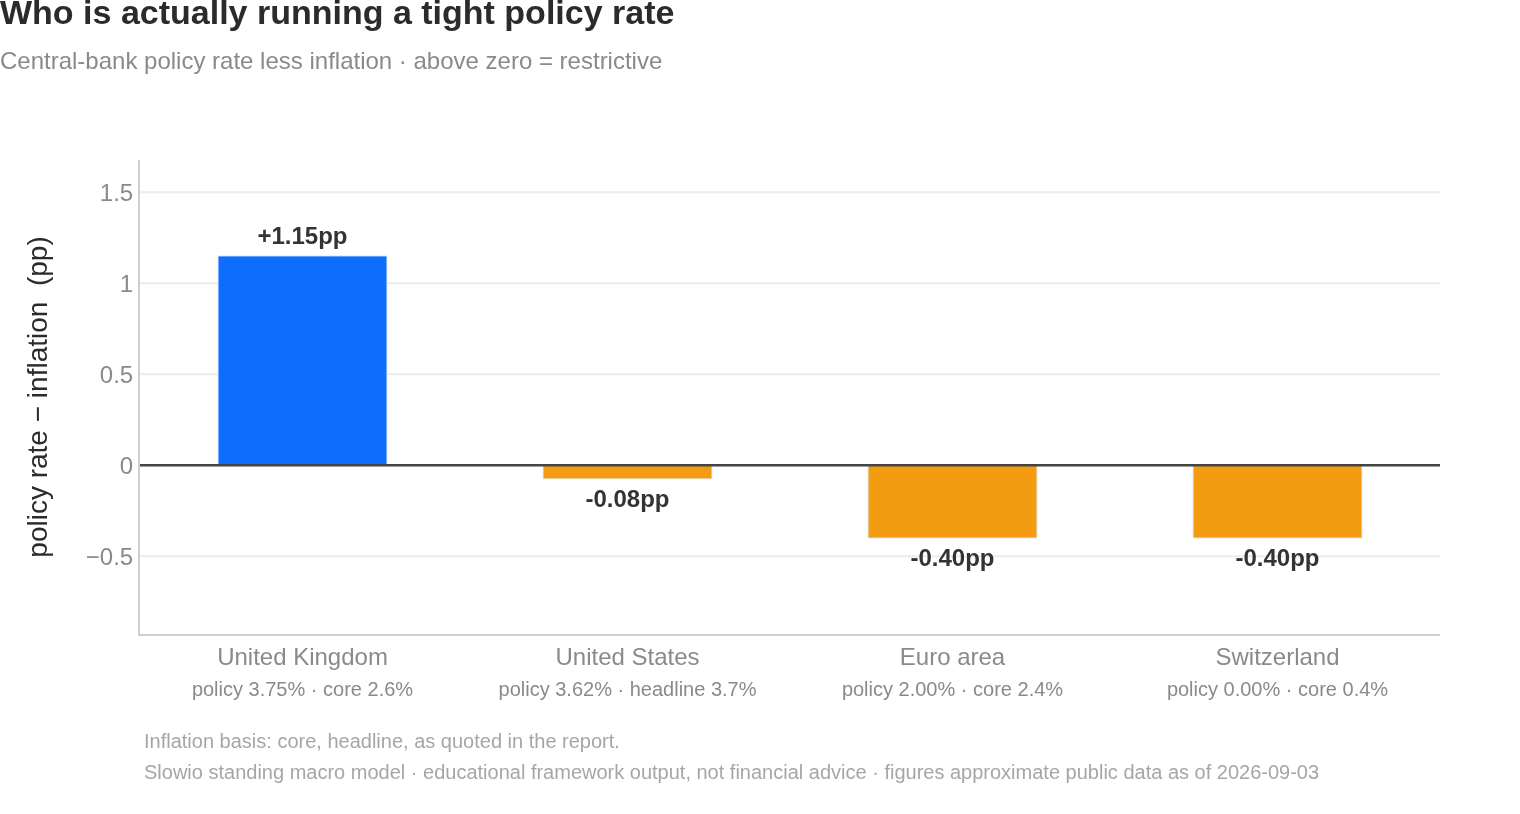
Switzerland (home market). SNB policy rate 0.00% (01.09.2026), unchanged at the 18 June 2026 assessment, with explicitly "increased willingness to intervene" against excessive franc appreciation; sight deposits CHF 454.4bn (13 Mar 2026, stale). Core inflation 0.4% (Feb 2026 per the Q1/2026 bulletin — the current Swiss CPI print is absent from the clippings and is flagged stale). EUR/CHF 0.9392, USD/CHF 0.8101, GBP/CHF 1.0969 (01.09.2026). With the policy rate at the zero floor and the franc below 0.94 per euro, the SNB's remaining tools are FX intervention and a return to negative rates; the 3.0pp core-inflation gap versus the euro area (0.4% vs 2.4%) mechanically supports further real franc appreciation. For Swiss-listed exporters this is a translation and pricing headwind on euro-area revenue, while imported energy — TTF up 126% y/y in euro terms — costs less in franc terms than for euro-area peers.
United Kingdom. Bank Rate 3.75%, held on 30 July 2026, next decision 17 September; the vote split is not in the clippings. CPI 2.9%, CPIH 3.1%, core CPI 2.6% (core CPIH 2.9%), services CPI 3.4% (from 3.6%; CPIH services unchanged at 3.6%) in the 12 months to July 2026. 10Y gilt and GBP/EUR are unavailable this run. UK headline sits 0.4pp below the euro area with services cooling — a relatively less hawkish backdrop for UK-exposed European issuers than the ECB's.
United States. Fed funds 3.50–3.75% with a 62–64% probability of a September hike; 10Y Treasury ~4.8% (intraday 4.818%, highest since Nov 2023) before dipping on 3 Sep; PCE inflation 3.7% YoY (the clipping labels this core PCE while the same block notes only headline was confirmed — treated as headline here); DXY 99.76 (2 Sep) easing to ~99.40 (3 Sep), after a +0.6% post-Jackson-Hole jump through the 200DMA. A 4.8% UST 10Y is the single largest external contributor to the 0.65% Bund term premium in the build above.
Japan. BoJ policy rate ~1.0% (June 2026 MPM; a 1.25% proposal at the July MPM was a personal view, not adopted); 10Y JGB above 3% for the first time in 30 years; 30Y auction cleared at 4.079% (prev. 3.952%, bid-to-cover 3.79x); USD/JPY ~157.80–158.40, off earlier levels above 160. Rising JGB yields reduce the incentive for Japanese buyers to hold hedged Bunds — a structural push on European long yields, hence on the discount rate for European equities.
China. No China CPI, PPI, export-growth or USD/CNY data in this run's clippings — the goods-deflation channel is unquantified this run, which is why the China force is held at only −0.10pp/3y.
Other emerging markets. India (RBI repo, CPI) and Russia (key rate, CPI) are absent from the clippings; no values are reported. Net for European-listed companies: the disinflationary import channel that capped goods prices in prior years cannot be verified today, while the energy channel is verifiably inflationary.
Analytical framework output — educational tool only, not financial advice. Do your own research.